Showing posts with label GDP. Show all posts

Tuesday, July 22, 2025

Which Country is a Bigger Beggar? India or Pakistan?

Most countries in the world today borrow money from various sources to finance their budget deficits. So do India and Pakistan. So why is it that only Pakistan's borrowing money gets labeled "begging"? Is it not begging when India borrows a lot more money than does Pakistan? Or is it that only borrowing money from the IMF qualifies as "begging"? Let's look into this double standard.  Currently, India's public debt to GDP ratio is 80% while Pakistan's is about 74%. India's private debt to GDP ratio is 17%, twice that of Pakistan. Do these figures mean that India is a bigger beggar than Pakistan? 


Debt-to-GDP Ratios Around the World. Source: Visual Capitalist


India is consistently among the largest borrowers from International Financial Institutions (IFIs), particularly the World Bank and the Asian Development Bank (ADB). It has been the top debtor to the World Bank for several years and a major borrower from the ADB.  India’s outstanding loan balance with the World Bank is almost double that of the next biggest debtor, Indonesia, which owed the bank $22.2 billion. Pakistan and Bangladesh followed with just short of $20 billion and $19.8 billion, respectively.  India is also the largest borrower from the Asian Development Bank (ADB). Since 1986, when ADB began lending to India, it has approved many loans, grants, and technical assistance totaling $55.3 billion.


Top Debtors to World Bank 2025. Source: Visual Nerd

One key difference between the two South Asian neighbors is the frequency with which Pakistan has been borrowing from the International Monetary Fund, known as the lender of last resort.  Pakistani economic managers have had a poor track record of managing hard currency reserves that the country needs to import what it lacks. Pakistani exports have failed to keep pace with its rising imports. This situation creates a crisis situation every few years and it forces the country to ask the IMF to lend its US dollars.  Currently, Pakistan ($6.3 billion) is IMF's 5th highest debtor after  Argentina ($31.1 billion), Ukraine ($10.19 billion), Egypt ($8.6 billion) and Ecuador ($6.6 billion). The only saving grace is the rapid growth in remittances from the Pakistani diaspora. In the last fiscal year that ended in June, 2025, overseas Pakistanis sent home $38.3 billion, representing 27% growth from the prior fiscal year. It helped Pakistan achieve a current account surplus of $2.1 billion, compared to a current account deficit of $2.1 billion in the previous fiscal year. 


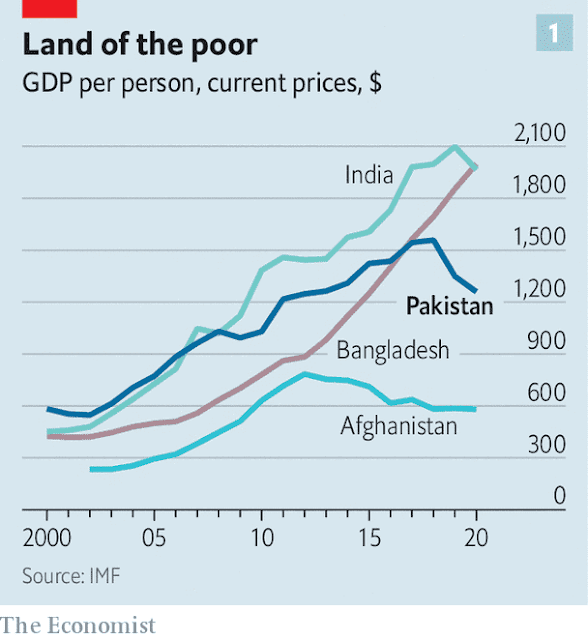
Global Income Levels By Country. Source: Visual Capitalist


Top IMF Debtor Nations. Source: IntelPoint


Pakistan's average economic growth of 5% a year has been faster than the global average since the 1960s, it has been slower than that of its peers in East Asia. It has essentially been constrained by Pakistan's recurring balance of payment (BOP) crises as explained by Thirlwall's Law. Pakistan has been forced to seek IMF bailouts 14 times in the last 75 years to deal with its BOP crises. This has happened in spite of the fact that remittances from overseas Pakistanis have grown 38X since 2000. Every time Pakistan has faced a balance of payments crisis, the result has been massive currency devaluation, high inflation and slower growth for a period of multiple years. The best way for Pakistan to accelerate its growth beyond 5% is to boost its exports by investing in export-oriented industries, and by incentivizing higher savings and investments. 

Related Links:

Haq's Musings

South Asia Investor Review

New Infrastructure Brings Socioeconomic Development to Thar Desert

Pakistan Revives Reko Diq Mining Project

Kachhi Canal and N-70 Projects Boost Pakistan's Balochistan

Iftikhar Chaudhry Scared Away Foreign Investors

Musharraf Earned Legitimacy by Good Governance

Vindictive Judges Pursue Musharraf

Rare Earths at Reko Diq?


Tuesday, October 29, 2024

Will India Grow Old Before it Gets Rich?

India's population has aged faster than expected while its economic growth has slowed over the last decade. This raises the obvious questions: Will India get old before it gets rich? Is India getting poorer relative to its peers in the emerging markets? 

India's Population Aging. Source: Semafor

As India's birth rate declines rapidly, the proportion of people age 60 and over is rising in the general population. This is particularly true of the southern states like Kerala and Tamil Nadu. Meanwhile, the expected demographic dividend from the youth bulge in the country has yet to materialize. High youth unemployment is threatening to cause serious social instability in the world's most populous country. It is also causing a massive brain drain.  

India's GDP Per Capita Compared to Emerging Markets Average. Source: IMF

India is losing its best and brightest to the West, particularly to the United States, at an increasingly rapid pace. A 2023 study of the 1,000 top scorers in the 2010 entrance exams to the Indian Institutes of Technology (IIT) — a network of prestigious institutions of higher learning based in 23 Indian cities — revealed the scale of the problem. Around 36% migrated abroad, and of the top 100 scorers, 62% left the country, according to a report in the science journal Nature.  Nearly two-thirds of those leaving India are highly educated, having received academic or vocational training. This is the highest for any country, according to the Organization for Economic Co-operation and Development.

Annual Population Growth Rapidly Falling Across India. Source: Semafor

India has the lowest GDP per capita among the 5 BRICS nations. The country's GDP growth rate is much slower than the average for emerging markets. It means that India is becoming poorer relative to the rest of the developing world. 

GDP Per Capita Map 2024. Source: IMF
India's GDP Per Capita is Very Low. Source: BBC

The north-side geographic divide in India is growing. The southern five of India’s 28 states (Andhra Pradesh, Karnataka, Kerala, Tamil Nadu and Telangana) contain 20% of the population and contribute 31% of the GDP, according to The Economist magazine. Among startups, 46% of tech “unicorns” are southerners, particularly from Bangalore. The five southern states provide 66% of the it-services industry’s exports. The latest craze is for “global capability centers”, where multinationals assemble their global auditors, lawyers, designers, architects and other professionals: 79% of these hubs are in the south.

Indian Parliament Seats Based on Current Population. Source: National Herald

There has always been a north-south divide in India in terms of population and wealth. The south has been wealthier and less populous than the north. But the political power is still concentrated in the poorer and more populous northern states. This situation serves Prime Minister Narendra Modi and his BJP party well. But it also creates significant resentment in southern states. 

In his book "The Raisina Model", British Lord Meghand Desai says that India's breakup can not be ruled out. Specifically, he points to three issues that could lead to it:

1.  Cow protection squads are killing Muslims and jeopardizing their livelihoods.  The current agitation about beef eating and gau raksha is in the Hindi belt just an excuse for attacking Muslims blatantly. As most slaughterhouses in UP are Muslim-owned, owners and employees of these places are prime targets.

2. India has still not fashioned a narrative about its nationhood which can satisfy all. The two rival narratives—secular and Hindu nation—are both centered in the Hindi belt extending to Gujarat and Maharashtra at the most. This area comprises 51% of the total population and around 45% of the Muslims in India.

3. India has avoided equal treatment of unequal units. Representation in the Rajya Sabha (Upper House of Parliament) is proportional to population size. The larger states dominate both Houses of Parliament. It would be difficult for small states to object, much less initiate reform. In future, small states could unite to present their case for better treatment. 

Related Links:

Haq's Musings

South Asia Investor Review

Guess Why Pakistani Analyst Uzair Younus is Making Headlines in India!

Ambassador Kishore Mahbubani: America Does Not Respect India

World Happiness Report: India Among Saddest Nations of the World

Balakot and Kashmir: Fact Checkers Expose Indian Lies

WB Poverty Update: India Biggest Contributor to Increase in Poverty

India in Crisis: Unemployment, Hunger Persist After Waves of Covid

Modi's Blunders and Delusions 

India's Israel Envy: What If Modi Attacks Pakistan?

Project Azm: Pakistan to Develop 5th Generation Fighter Jet

Pakistan Navy Modernization

Pakistan's Sea-Based Second Strike Capability

Who Won the 1965 War? India or Pakistan?

Is the West Unwittingly Helping Modi Realize His Akhand Bharat Hindutva Dream?

Has Pakistan Lost All Wars? 


Sunday, August 25, 2024

Following the Money: Insights into Pakistan's Budget 2024-25

A look at Pakistan's current fiscal year 2024-25 budget helps gain insights into how the country is run. It shows the money flows from the key sources of revenue and the nation's spending priorities. Total planned federal spending for the current fiscal year is Rs.18,900 billion (about 69 billion U.S. dollars). This figure does not include the transfer of Rs. 7,438 (US$ 26 billion) from the federal government to the provinces. Under the 18th amendment passed in 2010, the federal government is obligated to share 57.5% of its revenue with the provinces. The federal government is primarily responsible for defense, foreign affairs, debt servicing, foreign trade, ports and shipping, and development programs, while food and agricultureeducation, healthcare and housing are devolved to the provinces. There still appears to be some overlap of domestic responsibilities between the federation and the provinces. 

Pakistan's Budget 2024-25 at a Glance. Visualization Courtesy of Prof Adil Najam


The federal government's total revenue is expected to be Rs. 17, 815 billion (US$ 65 billion). In addition, Islamabad plans to borrow Rs. 8,470 billion ($31 billion) during the fiscal year. Interest payments of Rs. 9,775 billion ($ 36 billion) will account for more than half of the federal budget this year.  Debt servicing costs will also exceed the planned borrowing (of Rs. 8,470 billion) for the year. In other words, all of what the government plans to borrow this fiscal year will be used to service the current debt on the books.  

Detailed Budget Visualization By Dr. Adil Najam via Dawn


Federal debt servicing costs (Rs. 9,775 billion or $35 billion, 9.3% of current GDP) have spiked in recent years due to the State Bank's tight monetary policy designed to fight persistent double digit inflation. In fact, interest payments on debt are by far the biggest single federal expenditure line item, far surpassing the Rs. 2, 122 billion ($7.7 billion or 2% of current GDP) defense spending. Higher interest rates have also dramatically slowed down the economy. 

Pakistani provinces raise some of their own revenue on top of the transfers from the federal government. For example, Punjab, the largest of the four provinces, plans to spend an estimated Rs. 4,643.4 billion ($17 billion); including the federal transfer of Rs. 3,683.1 billion and about Rs. 960 billion ($3.5 billion) of provincial tax revenue. 

Sind, the second largest province, has a Rs. 3,056 ($11 billion) budget that includes Rs. 1,854 billion from the federal government, and Rs. 1,202 billion ($4.35 billion) from its revenue sources. KP, the third largest province,  has a Rs1,754 billion ($6.4 billion) budget, including Rs. 1,222 billion from the federal government and Rs. 532 billion ($1.9 billion) provincial revenue. Balochistan's budget is Rs. 956 billion ($3.5 billion) that includes Rs. 667 billion from the federal government and Rs. 290 billion ($1 billion) from its resources.

Altogether, the federal and provincial governments expect to raise about $75 billion in revenue, representing 20% of $375 billion GDP for fiscal year 2023-24. This is not bad for a developing country like Pakistan.  The defense allocation of Rs. 2,122, the second largest federal expenditure, is a mere 2% of the current GDP.  The biggest expenditure this year will be the interest payments of Rs. 9,775, accounting for over 50% of the federal budget and 9.3% of the current GDP. These debt servicing costs will hopefully come down as the State Bank cuts its interest rates this year and next. Lower interest payments in future years should free up money for other more pressing needs in the areas of education, healthcare, energy and infrastructure. 

Related Links:

Haq's Musings

South Asia Investor Review

Solar Power Boom in Pakistan

Pakistan Electric Vehicle Policy

Nuclear Power in Pakistan

Can Urban Forests Beat the Heat in Pakistani Cities

Pakistan's Response to Climate Change

IPP Contacts Bankrupting Pakistan

Renewable Energy for Pakistan

Net Metering in Pakistan

Pakistan's Digital Public Infrastructure Transforming Lives

My Family's Contribution to Climate Action

China-Pakistan Economic Corridor

Ownership of Appliances and Vehicles in Pakistan

CPEC Transforming Pakistan

Pakistan's $20 Billion Tourism Industry Boom

Riaz Haq's YouTube Channel

PakAlumni Social Network

Thursday, June 13, 2024

Agriculture: A Rare Bright Spot in Pakistan's Economy

Pakistan's agriculture sector grew 6.3% in 2023-24, far outpacing the overall economy that grew just 2.38%, according to the Economic Survey of Pakistan 2023-24.  This is good news for about 40% of the country's population working in the agriculture sector. By contrast, India's agriculture growth slowed to 1.2% in recent quarters. Studies have shown that strong growth in agriculture helps reduce poverty in developing nations like India and Pakistan. 

Snapshot of Pakistan's Economy. Source: Economic Survey of Pakistan 2023-24


The agriculture growth in Pakistan was the highest in 19 years. All major crops saw significant increases. Wheat output jumped 11.6% from 28.2 million tons last year to 31.4 million tons this year, the economic survey said. Cotton, severely damaged by floods and rains last year, reached 10.2 million bales compared to 4.9 million bales last year, growing by 108.2%. Rice output also saw a significant increase — up by 34.8% — reaching 9.9 million tons compared to 7.3 million tons. 

Strong crop output is in part the result of higher yields from increased water and fertilizer availability to farmers, according to the economic survey. 

The survey said the water availability during Kharif 2023 increased to 61.9 million acre-feet (MAF) from 43.3 MAF in Kharif 2022 (when the floods hit). For Rabi 2023-24, the water availability was 30.6 MAF, showing an increase of 4.1% over Rabi 2022-23.

Domestic fertilizer production during FY24 (July-March) rose by 17.3% to 3.25 million tons compared to 2.77 million tons in the same period of FY23. Fertilizer imports also increased by 23.7%, reaching 524,000 ton­s. The availability of fertilizer increased by 18.1% to 3.77 million tons. 

Pakistan's Rice Exports Soared 80% in Current Fiscal Year. Source: FT

The value of Pakistan’s rice exports soared to $3.6 billion over the last 11 months, up from $2 billion in July to May 2022-23. Its previous record for was 4.8 million metric tons of rice exports, valued at about $2.5 billion in 2021-22, according to the Financial Times

Pakistan is among the world's largest food producing countries. It produces large and growing quantities of cereals, meat, milk, fruits and vegetables. Currently, Pakistan produces about 38 million tons of cereals (mainly wheat, rice and corn), 17 million tons of fruits and vegetables, 70 million tons of sugarcane, 60 million tons of milk and 4.5 million tons of meat.  Total value of the nation's agricultural output exceeds $70 billion.  Improving agriculture inputs and modernizing value chains can help the farm sector become much more productive to serve both domestic and export markets.  

Agriculture is considered a key tool for reducing poverty in developing countries like Pakistan. It employs almost half of the rural workforce, contributes around 20% to the country's GDP, and provides raw materials for agro-based industries, according to a study by Yaping Liu, Asad Amin, Samma Faiz Rasool, and Qamar Uz Zaman.  However, some studies suggest that agriculture may only help mitigate rural poverty in the long term, while other sources say that sustainable agriculture practices can significantly improve agricultural production and reduce poverty.

Related Links:

Friday, March 29, 2024

Agriculture, Caste, Religion and Happiness in South Asia

Pakistan's agriculture sector GDP grew at a rate of 5.2% in the October-December 2023 quarter, according to the government figures. This is a rare bright spot in the overall national economy that showed just 1% growth during the quarter. Strong performance of the farm sector gives the much needed boost for about 37% of Pakistan's workforce engaged in agriculture. It helps the country's rural economy improve their living standards. In the same period, India's agriculture sector that employs 43% of the workforce slowed to 1.2% growth. This could be one possible contributing factor for Pakistan (rank108) significantly outperforming India (rank 126) on the World Happiness Index once again. 

World Happiness Map 2023. Source: Gallup

Pakistan has seen bumper crops of rice, corn, wheat, sugar and cotton this fiscal year after the devastation caused by massive floods in the prior year. During the first six months of the current fiscal year 2023-24, exports of agro and food products from Pakistan have soared by 64% as compared to the same period during 2022-2023. In the month of December alone, there was a growth of 118%, as $882 million of food was exported as compared  to $404 million in the same month in 2022-23. Pakistan's gains in the food export market have come at a time when India has had to limit or ban exports of rice, corn, sugar and other commodities due to crop failures.  

The World Happiness Report attributes India's poor ranking in the Index to widespread caste discrimination in the country. Older Indians belonging to upper castes, and “never experience[d] discrimination or ill-treatment” were “more satisfied with their lives”, according to the report.

Caste discrimination contributed “significantly to the caste-based discrepancies in life satisfaction”, the research showed. Caste backgrounds determined access to education, social services, health care or financial security in India.  Individuals with secondary or higher education, and those of higher social castes reported higher life satisfaction than those without access to formal education and those from Scheduled Castes (SC) and Scheduled Tribes (ST).

Another factor contributing to India's unhappiness is the ruling party's targeting of its minorities, including Christians, Muslims and Sikhs. Here's an excerpts from Rohit Khanna's piece in The Quint describing this issue:

"In recent years, 20 percent of India, our minorities, have been targeted – economically, socially, and physically. We have all seen multiple viral videos calling for the economic boycott of Muslims, of them being mob-lynched on the roads, of their homes being bulldozed, of inter-faith marriages being targeted as ‘love-jihad’ and more. We have seen videos of Christian pastors and congregations being roughed up, and of church buildings being vandalised. We have seen protesting Sikh farmers being vilified on communal lines as ‘Khalistanis’". 

Average MPCE (Monthly Per Capita Consumption Expenditure) for Indian Muslims is only Rs. 2,170.  Average MPCE for upper caste Hindus is Rs. 3,321, the highest of all groups. Lower caste Hindus fare much worse than upper caste Hindus, according to Indian government data

Average Monthly Per Capita Consumption Expenditure by Caste in India. Source: Hindustan Times

India is almost totally dominated by the upper caste Hindus. It is not just the 220 million Dalits (untouchables), or the 190 million Muslims, or the 110 million from “scheduled tribes” (Adivasis)  who are under-represented in positions of power and privilege, but also the 40-50% of Hindus who come from the widest tier of the pyramid, the shudras or laboring castes, known as Other Backwards Classes (OBCs), according to a report in The Economist Magazine.

Some Indians claim without evidence that the Indian Muslims are richer than Pakistani Muslims. The fact is that the average monthly per capita expenditure (MPCE) in Pakistan was PKR 5,959 in 2019-20, the year closest to the 2021-22 for which the Indian MPCE data is available. Using the 2019 average exchange rate of 2.136 PKR to INR, this works out to MPCE of INR 2,789 in Pakistan, higher than for Indian Hindus (INR 2,470) and Muslims (INR 2,170).  As to the cost of living in the two countries, Pakistan is 15.8% cheaper than India without rent and 20.1% cheaper with rent, according to Numbeo

While it is true the Pakistani currency has suffered significant devaluation in the last couple of years, there have been large increases in wages. Pakistan's minimum wage has increased 14 times since 2001, from 14% to 67%. The minimum wage for unskilled workers in 2023 is 32,000 Pakistani rupees per month, up from 25,000 rupees in 2022. The cost of living has been a key factor in determining the new rate. 

Income Poverty in Bangladesh, India and Pakistan. Source: Our World in Data


Over 75% of the world's poor deprived of basic living standards (nutrition, cooking fuel, sanitation and housing) live in India compared to 4.6% in Bangladesh and 4.1% in Pakistan, according to a recently released OPHI/UNDP report on multidimensional poverty.  Here's what the report says: "More than 45.5 million poor people are deprived in only these four indicators (nutrition, cooking fuel, sanitation and housing). Of those people, 34.4 million live in India, 2.1 million in Bangladesh and 1.9 million in Pakistan—making this a predominantly South Asian profile". 

Related Links:

Sunday, March 19, 2023

Why Does India Lag So Far Behind China?

Indian mainstream media headlines suggest that Pakistan's current troubles are becoming a cause for celebration and smugness across the border. Hindu Nationalists, in particular, are singing the praises of Indian Prime Minister Narendra Modi and some Pakistani analysts have joined this chorus. This display of triumphalism and effusive praise of India beg the following questions: Why are Indians so obsessed with Pakistan? Why do Indians choose to compare themselves with much smaller Pakistan rather than to their peer China? Why does India lag so far behind China when the two countries are equal in terms of population and number of consumers, the main draw for investors worldwide? Obviously, comparison with China does not reflect well on Hindu Nationalists because it deflates their bubble. 

Comparing China and India GDPs. Source: Statistics Times


China was poorer than India until 1990 in terms of per capita income. In 2001, both nations were included in Goldman Sachs' BRICs group of 4 nations seen as most favored destinations for foreign direct investment. Since the end of the Cold War in 1990, the western nations, including the United States and western Europe, have supported India as a counterweight to China. But a comparison of the relative size of their economies reveals that China had a nominal GDP of US$17.7 trillion in 2021, while India’s was US$3.2 trillion. India invests only 30% of its GDP, compared with 50% for China; and 14% of India's economy comes from manufacturing, as opposed to 27% of China, according to the World Bank.


A recent SCMP opinion piece by Sameed Basha titled "Is India ready to take China’s place in the global economy? That’s just wishful thinking" has summed it up well: 

"Comparing China to India is like comparing apples with oranges, with the only similarity being their billion-plus populations.......China is transforming itself into a technologically driven economy in order to exceed the potential of the US. In contrast, India is attempting to position itself as a market-driven economy utilizing its large population as a manufacturing base to compete with China........In its 2022 Investment Climate Statement on India, the US State Department called the country “a challenging place to do business” and highlighted its protectionist measures, increased tariffs and an inability to adjust from “Indian standards” to international standards". 

Over 1.5 million patent applications were filed in China in 2021, the highest number in the world. By comparison, the patent filings in India were 61,573, according to the World Intellectual Property Organization. China spends 2.4% of its GDP on research and development compared to India's 0.66%, according to the World Bank
Top Patent Filing Nations in 2021. Source: WIPO.Int

With growing Washington-Beijing tensions,  the United States is trying to decouple its economy from China's. The Wall Street Journal has reported that the Biden administration is turning to India for help as the US works to shift critical technology supply chains away from China and other countries that it says use that technology to destabilize global security.

India's Weighting in MSCI EM Index Smaller Than Taiwan's. Source: Nikkei Asia


The US Commerce Department is actively promoting India Inc to become an alternative to China in the West's global supply chain.  US Commerce Secretary Gina Raimondo recently told Jim Cramer on CNBC’s “Mad Money” that she will visit India in March with a handful of U.S. CEOs to discuss an alliance between the two nations on manufacturing semiconductor chips. “It’s a large population. (A) lot of workers, skilled workers, English speakers, a democratic country, rule of law,” she said.

India's unsettled land border with China will most likely continue to be a source of growing tension that could easily escalate into a broader, more intense war, as New Delhi is seen by Beijing as aligning itself with Washington

In a recent Op Ed in Global Times, considered a mouthpiece of the Beijing government, Professor Guo Bingyun  has warned New Delhi that India "will be the biggest victim" of the US proxy war against China. Below is a quote from it: 

"Inducing some countries to become US' proxies has been Washington's tactic to maintain its world hegemony since the end of WWII. It does not care about the gains and losses of these proxies. The Russia-Ukraine conflict is a proxy war instigated by the US. The US ignores Ukraine's ultimate fate, but by doing so, the US can realize the expansion of NATO, further control the EU, erode the strategic advantages of Western European countries in climate politics and safeguard the interests of US energy groups. It is killing four birds with one stone......If another armed conflict between China and India over the border issue breaks out, the US and its allies will be the biggest beneficiaries, while India will be the biggest victim. Since the Cold War, proxies have always been the biggest victims in the end". 

Related Links:

Haq's Musings

South Asia Investor Review

Do Indian Aircraft Carriers Pose a Threat to Pakistan's Security?

Can Washington Trust Modi as a Key Ally Against China?

Ukraine Resists Russia Alone: A Tale of West's Broken Promises

Ukraine's Lesson For Pakistan: Never Give Up Nuclear Weapons

AUKUS: An Anglo Alliance Against China?

Russia Sanction: India Profiting From Selling Russian Oil

Indian Diplomat on Pakistan's "Resilience", "Strategic CPEC"

Vast Majority of Indians Believe Nuclear War Against Pakistan is "Winnable"


Tuesday, June 28, 2022

Pakistan's Fiscal Year 2022 GDP Reaches $1.62 Trillion in Purchasing Power Parity (PPP) Terms

Economic Survey of Pakistan 2021-22 confirms that the nation's GDP grew nearly 6% in the current fiscal year, reaching $1.62 Trillion in terms of purchasing power parity (PPP). It first crossed the trillion dollar mark in 2017. In nominal US$ terms, the size of Pakistan's economy is now $383 billion. In terms of the impact of economic growth on average Pakistanis, the per capita average daily calorie intake jumped to 2,735 calories in FY 2021-22 from 2,457 calories in 2019-20. Pakistan experienced broad-based economic growth across all key sectors in FY 21-22; manufacturing posted 9.8% growth, services 6.2% and agriculture 4.4%. The 4.4% growth in agriculture is particularly welcome; it helps reduce rural poverty.  The country's per capita income is $1,798 in nominal terms and $7,551 in PPP dollars.  These figures do not yet show up in Google searches. Under former Prime Minister Imran Khan's leadership, Pakistan succeeded in achieving outstanding economic growth and nutritional improvements in spite of surging global food prices amid the Covid19 pandemic.  Increasing energy consumption and soaring global energy prices have rapidly depleted Pakistan's forex reserves, forcing the country to seek yet another IMF bailout.  History tells us that these bailouts have been forced whenever Pakistan's GDP growth has exceeded 5%. The best way for Pakistan to accelerate its growth beyond 5% in a sustainable manner is to boost its exports by investing in export-oriented industries, and by incentivizing higher savings and investments. 

Pakistan Economic Data. Source: IMF April 2022


The IMF (International Monetary Fund) has updated its website in April, 2022 with data reported for FY 2020-21. It's not unusual for the IMF data reporting to lag by a year or more. Pakistan's Economic Survey 2021-22 was published in June, 2022. 

Sector-wise Economic Growth. Source: Economic Survey of Pakistan 2021-22


Pakistan experienced broad-based economic growth across all key sectors in FY 21-22; manufacturing posted 9.8% growth, services 6.2% and agriculture 4.4%. The 4.4% growth in agriculture is particularly welcome; it helps reduce rural poverty. 

In terms of the impact of economic growth on average Pakistanis, the per capita average daily calorie intake jumped to 2,735 calories in FY 2021-22 from 2,457 calories in 2019-20. The biggest contributor to it is the per capita consumption of fresh fruits and vegetables which soared from 53.6 Kg to 68.3 Kg, less than half of the 144 Kg (400 grams/day) recommended by the World Health Organization. Healthy food helps cut disease burdens and reduces demand on the healthcare system. Under former Prime Minister Imran Khan's leadership, Pakistan succeeded in achieving these nutritional improvements in spite of surging global food prices amid the Covid19 pandemic

Pakistan Per Capita Daily Calorie Consumption. Source: Economic Surveys of Pakistan


The trend of higher per capita daily calorie consumption has continued since the 1950s. It has risen from about 2,078 in 1949-50 to 2,400 in 2001-02 and 2735 in 2021-22. The per capita per day protein intake in grams increased from 63 to 67 to about 75 during these years. Health experts recommend that women consume at least 1,200 calories a day, and men consume at least 1,500 calories a day, says Harvard Health Publishing.  The global average has increased from 2360 kcal/person/day in the mid-1960s to 2900 kcal/person/day currently, according to the Food and Agricultural Organization (FAO). The USDA (United States Department of Agriculture) estimates that most women need 1,600 to 2,400 calories, while the majority of men need 2,000 to 3,000 calories each day to maintain a healthy weight. Global Hunger Index defines food deprivation, or undernourishment, as consumption of fewer than 1,800 calories per day.

Share of Overweight or Obese Adults. Source: Our World in Data


The share of overweight or obese adults in Pakistan's population is estimated by the World Health Organization at 28.4%. It is 20% in Bangladesh, 19.7% in India, 32.3% in China, 61.6% in Iran and 68% in the United States.   

Major Food Items Consumed in Pakistan. Source: Economic Survey of Pakistan 2021-22

The latest edition of the Economic Survey of Pakistan estimates that per capita calories come from the annual per capita consumption of  164.7 Kg of cereals, 7.3 Kg of pulses (daal), 28.3 Kg of sugar, 168.8 liters of milk, 22.5 Kg of meat, 2.9 Kg of fish, 8.1 dozen eggs, 14.5 Kg of ghee (cooking oil) and 68.3 Kg of fruits and vegetables.  Pakistan's economy grew 5.97% and agriculture outputs increased a record 4.4% in FY 2021-22, according to the Economic Survey. The 4.4% growth in agriculture has boosted consumption and supported Pakistan's rural economy.  

The minimum recommended food basket in Pakistan is made up of basic food items (cereals, pulses, fruits, vegetables, meat, milk, edible oils and sugar) to provide 2150 kcal and 60gram protein/day per capita. 

The state of Pakistan's social sector is not as dire as the headlines suggest. There are good reasons for optimism. Key indicators show that nutrition and health in Pakistan are improving but such improvements need to be accelerated. 

Related Links:

Monday, January 24, 2022

Pakistan Cut Public Debt in Half On Musharraf's Watch in 1999-2008

In 1999, President Pervez Musharraf inherited a massive debt of over 100% of GDP run up by the Pakistan Peoples Party and the Pakistan Muslim League (Nawaz) governments in 1990s. Musharraf's policies not only revived the bankrupt economy but also brought down debt to 52% of GDP by 2007. 

Pakistan Debt to GDP 1995-2021. Source: IMF


PPP Government's 2008 Letter to IMF:

In a letter to the International Monetary Fund in 2008, the PPP government hailed Musharraf's economic record without mentioning his name in the following words:

"Pakistan's economy witnessed a major economic transformation in the last decade (2000-2008). The country's real GDP increased from $60 billion to $170 billion, with per capita income rising from under $500 to over $1000 during 2000-07.....the volume of international trade increased from $20 billion to nearly $60 billion. The improved macroeconomic performance enabled Pakistan to re-enter the international capital markets in the mid-2000s. Large capital inflows financed the current account deficit and contributed to an increase in gross official reserves to $14.3 billion at end-June 2007. Buoyant output growth, low inflation, and the government's social policies contributed to a reduction in poverty and improvement in many social indicators". (see MEFP, November 20, 2008, Para 1).

Savings and Investments:

Domestic savings rate reached 18% of the GDP and foreign direct investment (FDI) hit a record level of $5.4 billion in 2007-8. This combination of domestic and foreign investments nearly tripled the size of the economy from $60 billion in 1999 to $170 billion in 2007, according to IMF. Exports nearly tripled from about $7 billion in 1999-2000 to $22 billion in 2007-2008, adding millions of more jobs. Pakistan was lifted from a poor, low-income country with per capita income of just $500 in 1999 to a middle-income country with per capita income exceeding $1000 in 2007.

FDI in Musharraf years came in many sectors, ranging from telecommunications to manufacturing.
Several mobile phone and Internet service operators built networks worth billions of dollars. Without this telecom infrastructure, there would be no tech industry, no freelancers and no fast-growing tech exports today.

New cement plants met growing demand that more than doubled cement consumption, FMCG (fast moving consumer goods) sector took off to meet demand from growing middle class and production of cars and motorcycles jumped. 


Human Capital Development: 

In addition to the economic revival, Musharraf focused on the social sector as well. Pakistan's Human Development Index (HDI) score grew an average rate of 2.7% per year under President Musharraf from 2000 to 2007, and then its pace slowed to 0.7% per year in 2008 to 2012 under elected politicians, according to the 2013 Human Development Report titled “The Rise of the South: Human Progress in a Diverse World”.


Primary Enrollment Source: Economic Survey of Pakistan

Youth Literacy Rate Source: Economic Survey of Pakistan

Overall, Pakistan's human development score rose by 18.9% during the Musharraf years and increased just 3.4% under elected leadership since 2008. The news on the human development front got even worse in the last three years, with HDI growth slowing down as low as 0.59% — a paltry average annual increase of under 0.20 per cent. Going further back to the  decade of 1990s when the civilian leadership of the country alternated between PML (N) and PPP,  the increase in Pakistan's HDI was 9.3% from 1990 to 2000, less than half of the HDI gain of 18.9% on Musharraf's watch from 2000 to 2007.

R&D Spending Jumped 7-fold as % of GDP 1999-2007 Source: World Bank

Acceleration of HDI growth during Musharraf years was not an accident.  Not only did Musharraf's policies accelerate economic growth, helped create 13 million new jobs, cut poverty in half and halved the country's total debt burden in the period from 2000 to 2007, his government also ensured significant investment and focus on education and health care. The annual budget for higher education increased from only Rs 500 million in 2000 to Rs 28 billion in 2008, to lay the foundations of the development of a strong knowledge economy, according to former education minister Dr. Ata ur Rehman. Student enrollment in universities increased from 270,000 to 900,000 and the number of universities and degree awarding institutions increased from 57 in 2000 to 137 by 2008. Government R&D spending jumped from 0.1% of GDP in 1999 to 0.7% of GDP in 2007. In 2011, a Pakistani government commission on education found that public funding for education has been cut from 2.5% of GDP in 2007 to just 1.5% - less than the annual subsidy given to the various PSUs including Pakistan Steel and PIA, both of which  continue to sustain huge losses due to patronage-based hiring.

Pakistan's High-Tech Exports Tripled as % of Manufactured Exports. Source: World Bank

Pakistan textile exports more than doubled from $5.2 billion to more than $11 billion during the Musharraf years. Exports soared 19.43% in 2001, 20% in 2004, 24.5% in 2005 and 11.23% in 2006, all on President Musharraf's watch, according to "The Rise and Fall of Pakistan's Textile Industry: An Analytical View" published by Javed Memon, Abdul Aziz and Muhammad Qayyum.     


Pakistan Textile Exports Growth. Source: Javed Memon

Pakistan experienced rapid economic and human capital growth in years 2000 to 2008 on President Pervez Musharraf's watch. Savings, investments and exports hit new records and the rate of increase in human development reached new highs not seen before or since this period.  Without this human capital, there would be no tech industry, no freelancers and no fast-growing tech exports today.

Employment Growth in South Asia. Source: World Bank

Pakistan's employment growth was the highest in South Asia region in 2000-2010, followed by Nepal, Bangladesh, India, and Sri Lanka in that order, according to a World Bank report titled "More and Better Jobs in South Asia".

Comparing Per Capita GDP Trajectory in South Asia. Source: The Economist

Until 2010, Bangladesh was a laggard in South Asia region. Its per capita income was about half of Pakistan's. Now Bangladesh's per capita GDP is higher than both India's and Pakistan's. What changed? The biggest change is Bangladeshi leader Shaikh Hasina's decision to stifle the unruly Opposition and the media to bring political and economic stability to the South Asian nation of 160 million people. It has eliminated a constant sense of crisis and assured investors and businesses of continuity of government policies. With development taking precedence over democracy, Shaikh Hasina followed the example of Asian Tigers  by focusing on export-led economic growth of her country. She incentivized the export-oriented garment industry and invested in human development. Bangladesh now outperforms India and Pakistan in a whole range of socioeconomic indicators: exports, economic growth, infant mortality rate, primary school enrollment, fertility rate and life expectancy.    

Related Links: