Showing posts with label World Bank. Show all posts

Sunday, December 7, 2025

World Bank: Pakistan is 88% Urbanized

The World Bank researchers have recently concluded that 88 per cent live in urban areas. Their conclusion is based on satellite imagery and the Degree of Urbanization (DoU) methodology. The official Pakistani figures released by the Pakistan Bureau of Statistics (PBS) put the current level of urbanization at 39%. The source of this massive discrepancy is the government's reliance on administrative boundaries rather than population density and settlement patterns, according to the World Bank working research paper titled  "When Does a Village Become a Town?". 

Urbanization in Pakistan. Source: World Bank

Urban areas are characterized by high population density, while rural areas are sparsely populated with more open space. Major differences include urban areas having more commercial development, diverse job opportunities, and a faster pace of life, while rural areas often focus on agriculture and have a slower pace of life with closer-knit communities but may face challenges with limited access to services. 

The World Bank’s Paper suggests that secondary cities and peri-urban areas — rather than megacities — are the primary drivers of recent urban expansion which are systematically overlooked in official Pakistani classifications. This discrepancy between functional and administrative classifications has significant fiscal and planning implications.

Pakistan's official data grossly underestimates urbanization, with Islamabad showing only 47% urban population compared to 90% under the DoU, while figures in Balochistan, Punjab, and Sindh are more closely aligned. In Khyber Pakhtunkhwa, the DoU estimates the urban population at nearly three times the official 15%, while Islamabad is mostly dense urban, and other provinces show mixed suburban and peri-urban growth. The report finds that Pakistan’s urban landscape has transformed dramatically over the past two decades. Since the early 2000s, a growing share of the rural population has left agriculture, transforming previously rural settlements into new and vibrant urban centers. Unlike Afghanistan, India and sub-Saharan Africa, the agriculture sector is no longer the top employer in Pakistan. Services sector is now the top employment sector in the country.

Top Employment Sector in Each Country. Source: Visual Capitalist

The policy research paper finds that misclassified areas reduce property tax revenues and undermine the planning and provision of critical public services. It also distorts spatial socioeconomic indicators, masking the true extent of urban-rural disparities and complicating the design of effective, evidence-based public policy.


Urbanization Comparison of Developing Nations Based on DoU Method

The DoU method facilitates cross-national comparisons, as it provides a consistent criteria. Application of the DoU reveals that, despite variation across urban typologies, the proportion of the population residing in urban areas exceeds 70 percent in all examined countries. The list (fig 2) includes Brazil and Pakistan (98% each). Bangladesh (79%), Egypt (83%), India (77%) and Mexico (82%).

The paper finds that Pakistan is among only a minority of countries that use purely administrative definitions to identify urban areas. Changing how the country determines urban areas to include population density, service access, and other urban characteristics will allow it, as the DoU shows, to account for a varied urban landscape. Recognizing the existence of areas between dense cities and rural villages can help to establish a staggered expansion of the areas subject to property taxes. Updating the urban classification could increase property taxes sevenfold, and new technologies can help modernize cadaster systems. Besides supporting the reclassification of what areas are urban, satellite data offers additional possibilities to identify properties and update the cadasters.

Related Links:

Haq's Musings

South Asia Investor Review

Pakistanis Happier Than Neighbors

Tipping Point: Pakistan Middle Class Grows to 55% of the Population

Karachi Safety Ranking Rising

Urbanization in Pakistan Highest in South Asia

Agriculture Sector in Pakistan

Karachi is World's Fastest Growing Megacity

Karachi's Human Development Index

Pakistan Rising or Failing: Reality vs Perception

Pakistan's Trillion Dollar Economy Among top 25

CPEC Myths and Facts

Gwadar Port

Riaz Haq's Youtube Channel

PakAlumni Social Network


Sunday, June 12, 2022

Indian Women's Labor Force Participation Falls to Just 19%, Lower Than Pakistan's 21%

Female labor force participation rate in India has recently fallen to just 19%, the second lowest after Afghanistan's 15% in the South Asia region. By contrast, Pakistan's women's labor force participation rate is 21%, Sri Lanka's 31% and Bangladesh's 35%. Prime Minister Narendra Modi's mishandling of the COVID19 pandemic has hit Indian women particularly hard, with 90% of those who lost their jobs now shut out of the workforce. 

Female Labor Force Participation Rate in South Asia. Source: World Bank


The precipitous loss of women workers is disastrous news for India's economy, which had started slowing before the COVID19 pandemic, according to a Bloomberg report. Rosa Abraham, an economics professor at Azim Premji University in Bengaluru, tracked more than 20,000 people as they navigated the labor market during the pandemic.. She found that after the first lockdown, women were several times more likely to lose their jobs than men and far less likely to recover work after restrictions were lifted. "When men are faced with this kind of a huge economic shock, then they have a fallback option," Abraham told Bloomberg. "They can navigate to different kinds of work. But for women, there is no such fallback option. They can't negotiate the labor market as effectively as men do." 

Women accounted for less than 11% of all jobs in 2019-20. But, they accounted for nearly 52% of the 7 million job losses since then, according to the Center for Monitoring Indian Economy (CMIE).  It gets worse in urban India. Women accounted for only 9% of total employment in urban India but they accounted for a massive 76% of the job losses here. The impact of this is a sharp fall in the labor participation of women. The female labor force participation rate among urban women was abysmally low at 9.4% in 2019-20 and it has since fallen to 7% in 2021-22.

COVID19 Pandemic Impact on Employment in India. Source: Bloomberg

Modi government has underplayed the death toll and the negative impact of the COVID19 pandemic in India. But the World Health Organization estimates that India had 4.730 million COVID19-related  deaths in 2020-21, nearly a third of 15 million global excess deaths attributed to the pandemic. India is followed by Russia with 1.073 million deaths and Indonesia with 1.03 million deaths. The United States with 933,795 deaths and Brazil with 681,219 deaths round out the top 5 countries that suffered the heaviest losses of life believed to be related to the pandemic. Mexico (625,923 deaths), Peru (289,654 deaths), Turkey (264,279 deaths) Egypt (251,635 deaths) and South Africa (238,893 deaths) are ranked number 6 through 10 in the world for excess deaths in 2020-21 period. Although Pakistan too had 8 times the official figure, it still does not figure in WHO's top 10 list for total number of COVID deaths. 

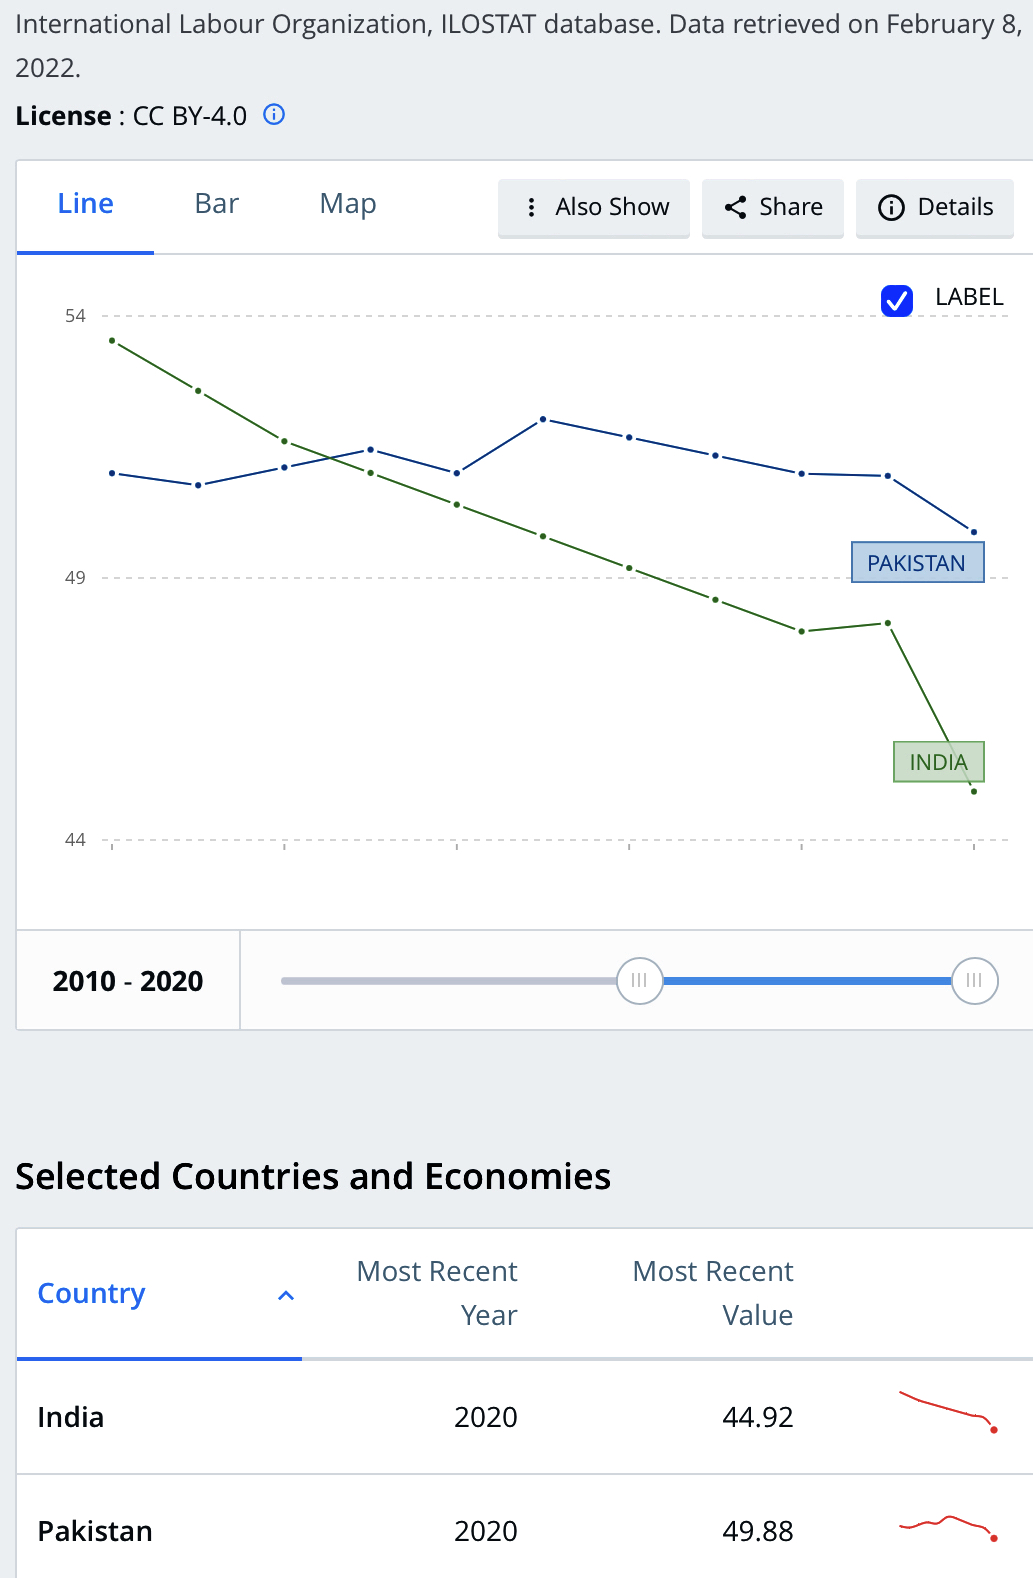
It's not just Indian women who have suffered job losses. India's overall labor participation rate (LPR) fell to 39.5% in March 2022, as reported by the Center for Monitoring Indian Economy (CMIE). It dropped below the 39.9% participation rate recorded in February. It is also lower than during the second wave of Covid-19 in April-June 2021. The lowest the labor participation rate had fallen to in the second wave was in June 2021 when it fell to 39.6%. The average LPR during April-June 2021 was 40%. March 2022, with no Covid-19 wave and with much lesser restrictions on mobility, has reported a worse LPR of 39.5%.

Labor Participation Rates in India and Pakistan. Source: ILO/World Bank


Youth  unemployment for ages 15-24 in India is 24.9%, the highest in the South Asia region. It is 14.8% in Bangladesh 14.8% and 9.2% in Pakistan, according to the International Labor Organization and the World Bank.  

Youth Unemployment in Bangladesh, India and Pakistan. Source: ILO, WB


In spite of the headline GDP growth figures highlighted by the Indian and world media, the fact is that it has been jobless growth. The labor participation rate (LPR) in India has been falling for more than a decade. The LPR in India has been below Pakistan's for several years, according to the International Labor Organization (ILO). 

Indian Employment Trends By Sector. Source: CMIE Via Business Standard

Construction and manufacturing sectors in India have been shedding jobs while the number of people working in agriculture has been rising, according to CMIE. 

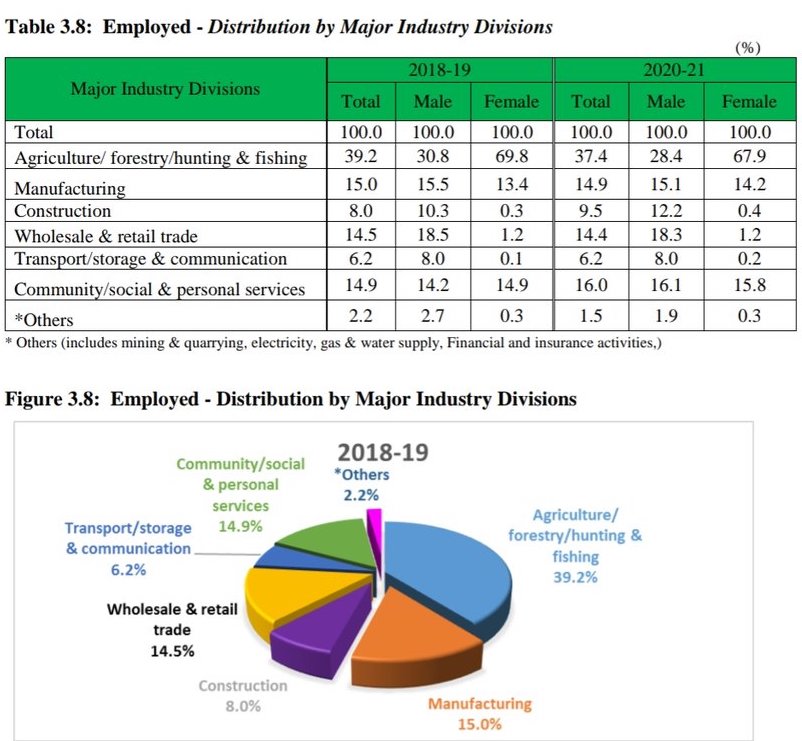
Pakistan Employment By Sectors. Source: PBS via Bilal Gilani

It is important to note that Pakistan’s economy has created 5.5 million jobs during the past three years – 1.84 million jobs a year, significantly higher than yearly average of new jobs created during the 2008-18 decade, according to the findings of Labor Force Survey (LFS) as reported by the Express Tribune paper. The biggest jump in share of employment (1.5%) was in the construction sector, spurred by Naya Pakistan construction incentives offered by the PTI government. 


Related Links:

Haq's Musings

South Asia Investor Review

Pakistan Among World's Largest Food Producers

Naya Pakistan Housing Program

Food in Pakistan 2nd Cheapest in the World

Indian Economy Grew Just 0.2% Annually in Last Two Years

Pakistan to Become World's 6th Largest Cement Producer by 2030

Pakistan's 2012 GDP Estimated at $401 Billion

Pakistan's Computer Services Exports Jump 26% Amid COVID19 Lockdown

Coronavirus, Lives and Livelihoods in Pakistan

Vast Majority of Pakistanis Support Imran Khan's Handling of Covid19 Crisis

Pakistani-American Woman Featured in Netflix Documentary "Pandemic"

Incomes of Poorest Pakistanis Growing Faster Than Their Richest Counterparts

Can Pakistan Effectively Respond to Coronavirus Outbreak? 

How Grim is Pakistan's Social Sector Progress?

Pakistan Fares Marginally Better Than India On Disease Burdens

Trump Picks Muslim-American to Lead Vaccine Effort

COVID Lockdown Decimates India's Middle Class

Pakistan Child Health Indicators

Pakistan's Balance of Payments Crisis

How Has India Built Large Forex Reserves Despite Perennial Trade Deficits

Conspiracy Theories About Pakistan Elections"

PTI Triumphs Over Corrupt Dynastic Political Parties

Strikingly Similar Narratives of Donald Trump and Nawaz Sharif

Nawaz Sharif's Report Card

Riaz Haq's Youtube Channel

Wednesday, April 20, 2022

World Bank: Pakistan Reduced Poverty and Grew Economy During COVID19 Pandemic

Pakistan poverty headcount, as measured at the lower-middle-income class line of US$3.20 PPP 2011 per day, declined from 37% in FY2020 to 34% in FY2021 in spite of the COVID19 pandemic, according to the World Bank's Pakistan Development Update 2022 released this month. The report said Pakistan's real GDP shrank by 1% in FY20, followed by 5.6% growth in FY21.  The report highlights high inflation and low savings rate as key economic issues. 

Pakistan's Macroeconomic Indicators. Source: World Bank


The report credited the PTI government led by former Prime Minister Imran Khan for timely policy measures, particularly the Ehsaas program, for mitigating the adverse socioeconomic impacts of the COVID-19 pandemic. Here's an excerpt of the report titled Pakistan Development Update 2022: 

"The State Bank of Pakistan (SBP) lowered the policy rate and announced supportive measures for the financial sector to help businesses and the Government expanded the national cash transfer program (Ehsaas) on an emergency basis. These measures contributed to economic growth rebounding to 5.6 percent in FY21.  However, long-standing structural weaknesses of the economy, particularly consumption-led growth, low private investment rates, and weak exports have constrained productivity growth and pose risks to a sustained recovery. Aggregate demand pressures have built up, in part due to previously accommodative fiscal and monetary policies, contributing to double-digit inflation and a sharp rise in the import bill with record-high trade deficits in H1 FY22 (Jul–Dec 2021). These have diminished the real purchasing power of households and weighed on the exchange rate and the country’s limited external buffers." 

The report cites high rates of inflation hurting the people, particularly the poor who spend about half of their income on food. Here's an excerpt: 

"Headline inflation rose to an average of 9.8 percent y-o-y in H1 FY22 from 8.6 percent in H1 FY21, driven by surging global commodity and energy prices and a weaker exchange rate. Similarly, core inflation has been increasing since September 2021. Accordingly, the State Bank of Pakistan (SBP) has been unwinding its expansionary monetary stance since September 2021, raising the policy rate by a cumulative 525 basis points (bps) and banks’ cash reserve requirement by 100 bps" 


Pakistan Savings Rate Comparison. Source: World Bank

The World Bank report highlights the low level of personal savings and investments as a key impediment to economic growth. Here's an excerpt: 

"The savings challenge has only been exacerbated by the low level of financial inclusion in the country, where even those who save are not saving with the financial system, and as such savings are not being fully leveraged to support capital formation. Only 21 percent of the population has access to an account and only 18 percent of the population uses digital payments. There are also large gaps in financial inclusion, with vulnerable segments having limited access at high prices. In terms of access to accounts, 7 percent of adult women have access compared to 35 percent of adult men, and 15 percent of young adults (ages 15–24) have access compared to 25 percent of older adults. It should be highlighted, however, that Pakistan has made notable gains on the financial inclusion agenda in recent years, supported by policy reforms and holistic strategies such as the National Financial Inclusion Strategy. However, despite the progress made, Pakistan underperforms on key metrics of financial inclusion in comparison to its peer comparators. Estimates suggest that less than 50 percent of domestic savings find their way to the financial sector, with the rest used in real estate, being intermediated through informal channels, or are soaked up directly by the government through National Savings. The incentive system is skewed such that savings flow outside of the financial sector. The large quantum of currency in circulation (CiC) in the economy is also indicative of this trend. The CiC/M2 ratio, which averaged 22 percent till June 2015 has increased to over 28 percent as of June 2021. The increase in CiC/M2 ratio translates into excess CiC of PKR1.4 trillion. These are resources that could have been intermediated for productive uses by the financial sector but are currently outside the sector." 

Related Links:


Sunday, November 3, 2019

Upward Income Mobility in Pakistan Better Than in India and Most Other Nations

Economic mobility across generations, also known as intergenerational mobility (IGM), is a key measure of human progress. It shows that Pakistan is doing relatively well, according to a World Bank sponsored study. The analysis examines whether those born in poverty or in prosperity are destined to remain in the same economic circumstances into which they were born, and looks back over a half a century at whether children’s lives are better or worse than their parents’ in different parts of the world.

Inter-Generational Income Mobility Map of the World 2018. Source: World Bank

Intergenerational Income Mobility Study:

The World Bank study uses a newly created 2018 database—the Global Database of Intergenerational Mobility (GDIM)—that covers more than 95 percent of the global population.  Intergenerational income mobility measures how children's incomes compare with their parents' incomes at similar stages of life over a period of 50 years.

Inter-Generational Income Inequality Scatter Plot of the World 2018. Source: World Bank

The study found that higher intergenerational income mobility is associated with lower income inequality.

More and more Pakistanis are sharing in their nation's development, according to World Economic Forum (WEF). Pakistan ranks 47 among 74 emerging economies ranked for inclusive development by WEF released recently at Davos, Switzerland. Inclusive development in the South Asian country has increased 7.56% over the last 5 years. World Economic Forum assesses inclusive development  based on "living standards, environmental sustainability and protection of future generations from further indebtedness."

Educational Mobility:

Pakistan ranks among the 10 worst performing countries in absolute educational mobility, defined as the share of adults that are more educated than their parents, and relative mobility, defined as the correlation between individuals’ education and that of their parents.

Intergenerational Educational Mobility. Source: World Bank

In terms of intergenerational education mobility, only 9.4% of Pakistanis born in the bottom half make it to the top compared with a median of 15% among developing economies. Compared with other South Asian countries (in IGM in education), however, Pakistan (9.4%) is doing marginally better than India (8.9%) and Bangladesh (8.6%), but worse than Nepal (11.4%), Afghanistan (12.3%), Sri Lanka (15.9%), and the Maldives (24.8%), according to the World Bank.

Comparison of Intergenerational Mobility in Pakistan. Source: World Bank 


WEF Inclusive Development Report 2018:

The WEF inclusive development index ranks Pakistan at 47, below Bangladesh at 34 but above India at 62. The 7.56% rate of increase in inclusive development in Pakistan is higher than 4.55% in Bangladesh and 2.29% in India. China ranks 26 and its inclusion is rising at a rate 2.94%.

WEF IDI Rankings. Source: WEF

Pakistan has improved its ranking from 52 last year to 47 this year, while India's rank worsened to 62 this year from 60 last year.  China's ranking also worsened from 15 last year to 26 this year.

Another WEF report compiled by Oxfam said the richest 1% of Indians took 73% of the wealth generated last year.

Income Share Change in Asia's Poorest Quintile: 

The share of national income of Pakistan's poorest 20% of households has increased from 8.1% to 9.6% since 1990 , according to the United Nations Economic and Social Commission for Asia and Pacific (NESCAP) Statistical Yearbook for 2015.  It's the highest share of income for the bottom income quintile in the region.

The countries where people in the poorest income quintile have increased their share of total income include Kyrgyzstan (from 2.5 per cent to 7.7), the Russian Federation (4.4 per cent to 6.5), Kazakhstan (7.5 per cent to 9.5) and Pakistan (8.1 per cent to 9.6).  India's bottom income quintile has seen its share of income drop from 9% to 7.8%.

Bottom Quintile Income Share Change. Source: UNESCAP Statistical Yearbook

Although more people in China have lifted themselves out of poverty than any other country in the world, the poorest quintile in that country now accounts for a lower percentage of total income (4.7 per cent) than in the early 1990s (8.0 per cent). The same unfortunate trend is observed for a number of other countries, including in Indonesia (from 9.4 per cent to 7.6) and in the Lao People’s Democratic Republic (from 9.3 per cent to 7.6).

CPEC Transforming Least Developed Regions:

Development of China Pakistan Economic Corridor (CPEC) is transforming Pakistan.  Among the parts of the contry being transformed the most by CPEC are some of the least developed regions in Balochistan and Sindh, specifically Gwadar and Thar Desert. Here is more on these regions:

Gwadar Port City:

Gwadar is booming. It's being called the next Shenzhen by some and the next Hong Kong by others as an emerging new port city in the region to rival Dubai. Land prices in Gwadar are skyrocketing, according to media reports. Gwadar Airport air traffic growth of 73% was the fastest of all airports in Pakistan where overall air traffic grew by 23% last year, according to Anna Aero publication.  A new international airport is now being built in Gwadar to handle soaring passenger and cargo traffic.


In addition to building a major seaport that will eventually handle 300-400 million tons of cargo in a year, China has built a school, sent doctors and pledged about $500 million in grants for an airport, hospital, college and badly-needed water supply infrastructure for Gwadar, according to Reuters.

The Chinese grants include $230 million for a new international airport in Gwadar, one of the largest such disbursements China has made abroad, according to researchers and Pakistani officials.

New development work in Gwadar is expected to create as many as 20,000 jobs for the local population.

Thar Desert:

Thar, one of the least developed regions of Pakistan, is seeing unprecedented development activity in energy and infrastructure projects.  New roads, airports and buildings are being built along with coal mines and power plants as part of China-Pakistan Economic Corridor (CPEC). There are construction workers and machinery visible everywhere in the desert. Among the key beneficiaries of this boom are Thari Hindu women who are being employed by Sindh Engro Coal Mining Company (SECMC) as part of the plan to employ locals. Highlighted in recent news reports are two Hindu women in particular: Kiran Sadhwani, an engineer and Gulaban, a truck driver.

Kiran Sadhwani, a Thari Hindu Woman Engineer. Source: Express Tribune

Thar Population:

The region has a population of 1.6 million. Most of the residents are cattle herders. Majority of them are Hindus.  The area is home to 7 million cows, goats, sheep and camel. It provides more than half of the milk, meat and leather requirement of the province. Many residents live in poverty. They are vulnerable to recurring droughts.  About a quarter of them live where the coal mines are being developed, according to a report in The Wire.

Hindu Woman Truck Driver in Thar, Pakistan. Source: Reuters

Some of them are now being employed in development projects.  A recent report talked of an underground coal gasification pilot project near the town of Islamkot where "workers sourced from local communities rested their heads after long-hour shifts".

2012 Intergenerational Mobility Study:

A 2012 study of 22 nations conducted by Prof Miles Corak for the Organization for Economic Cooperation and Development (OECD) has found income heritability to be greater in the United States, the United Kingdom, Italy, China and 5 other countries than in Pakistan.

The study's findings, presented by the author in testimony to the US Senate Finance Committee on July 6, 2012, rely on the computation of "inter-generational earnings elasticity" which the author explains as follows:


"(It) is the percentage difference in earnings in the child’s generation associated with the percentage difference in the parental generation. For example, an intergenerational elasticity in earnings of 0.6 tells us that if one father makes 100% more than another then the son of the high income father will, as an adult, earn 60% more than the son of the relatively lower income father. An elasticity of 0.2 says this 100% difference between the fathers would only lead to a 20% difference between the sons. A lower elasticity means a society with more mobility."

Intergenerational Mobility in Pakistan:

Corak calculates that the intergenerational earnings elasticity in Pakistan is 0.46, the same as in Switzerland. It means that a difference of 100%  between the incomes of a rich father and a poor father is reduced to 46% difference between their sons' incomes. Among the 22 countries studied, Peru, China and Brazil have the lowest economic mobility with inter-generational elasticity of 0.67, 0.60 and 0.58 respectively. The highest economic mobility is offered by Denmark (0.15), Norway (0.17) and Finland (0.18).


The author also looked at Gini coefficient of each country and found reasonably good correlation between Gini and intergenerational income elasticity.

 In addition to Corak, there are other reports which confirm that Pakistan has continued to offer  significant upward economic and social mobility to its citizens over the last two decades. Since 1990, Pakistan's middle class had expanded by 36.5% and India's by only 12.8%, according to an ADB report titled "Asia's Emerging Middle Class: Past, Present And Future".

 More evidence of upward mobility is offered by Euromonitor market research indicating that Pakistanis are seeing rising disposable incomes. It says that there were 1.8 million Pakistani households (7.55% of all households) and 7.9 million Indian households (3.61% of all households) in 2009 with disposable incomes of $10,001 or more. This translates into 282% increase (vs 232% in India) from 1995-2009 in households with disposable incomes of $10,001 or more. Consumer spending in Pakistan has increased at a 26 percent average pace the past three years, compared with 7.7 percent for Asia, according to Bloomberg.

Summary:

The latest World Bank Study based on 2018 data shows that Pakistan continues to offer higher intergenerational economic mobility than most of the rest of the world. It reconfirms an earlier 2012 study of 22 nations by Miles Corak.   More and more Pakistanis are sharing in their nation's development, according to World Economic Forum (WEF). Pakistan ranks 47 among 74 emerging economies ranked for inclusive development by WEF released recently at Davos, Switzerland. Inclusive development in the South Asian country has increased 7.56% over the last 5 years. World Economic Forum assesses inclusive development  based on "living standards, environmental sustainability and protection of future generations from further indebtedness."

Related Links:

Haq's Musings

South Asia Investor Review

Pakistan Offers Higher Economic Mobility Than US, China

Pakistani-Americans Among Top 5 Most Upwardly Mobile Groups in US

Pakistan's Inclusive Growth

Pakistani-American Stars in "Big Sick" Movie

Pakistani-American Population Growth 2nd Fastest Among Asian-Americans

Silicon Valley Pakistani-Americans

A Dozen British Pakistanis in UK Pariament


Sunday, January 14, 2018

Pakistan Economy is the World's Third Fastest Growing Among Top 25 Economies

Pakistan is now the world's third fastest growing economy among the world's top 25 economies with PPP GDP of over one trillion US dollars, according to  the International Monetary Fund (IMF). IMF has recently raised the country's 2018 growth forecast to 5.6%.
Courtesy:  Ashraf Hameedi, Highforest Capital

Pakistan 3rd Fastest Among Top 25: 


Spectator Index has ranked India first with 7.3% growth, followed by China (6.5%), Pakistan (5.6%), Indonesia (5.3%) and Turkey (3.7%) among the world's 25 largest economies in terms of PPP GDP.

Earlier in October 2017, the International Monetary Fund (IMF) forecast Pakistan's economy to grow at 6.3% CAGR over 2017-2022.

World Bank: 

The World Bank sees Pakistan's GDP to grow 5.5% in current fiscal year 2017-18 ending in June 2018, a full percentage point faster than the 4.5% average GDP growth for Emerging and Developing Economies (EMDEs) that include Argentina, Brazil, China, India, Nigeria and Russia among others. However, Pakistan economic growth continues to lag growth forecast for regional economies of India and Bangladesh. The report also highlights the issue to growing trade deficit and current account gap that could lead to yet another balance of payments crisis for Pakistan requiring another IMF bailout.

Source: World Bank Group
Pakistan GDP Growth: 

Here's an excerpt of the January 2018 World Bank report titled "Global Economic Prospects" as it relates to Pakistan:

"In Pakistan, growth continued to accelerate in FY2016/17 (July-June) to 5.3 percent, somewhat below the government’s target of 5.7 percent as industrial sector growth was slower than expected. Activity was strong in construction and services, and there was a recovery in agricultural production with a return of normal monsoon rains. In the first half of FY2017/18, activity has continued to expand, driven by robust domestic demand supported by strong credit growth and investment projects related to the China-Pakistan Economic Corridor. Meanwhile, the current account deficit widened to 4.1 percent of GDP compared to 1.7 percent last year, amid weak exports and buoyant imports."

Growing External Account Imbalance: 

The report correctly points out the problem of growing current account deficit that could turn into a balance of payments crisis unless the trade deficits are brought under control. Recent trends in the last three months do offer some hope with December 2017 exports up 15% while imports increased 10%. Exports in November increased 12.3%.

Along with double digit increase in exports in the last two months, Pakistan received remittances amounting to $1.724 billion in December 2017, 8.72% higher compared with $1.585 billion the country received in the same month of the previous year, according to data released by the State Bank of Pakistan (SBP), as reported by Express Tribune.

Summary:

Pakistan is the third fastest growing economy among the top 25 economies in terms of purchasing power parity.  Pakistan's economic growth is continuing to accelerate amid rising rising investments led by China-Pakistan Economic Corridor related infrastructure and energy related projects.  The IMF sees Pakistan economy growing at 5.6% while the World Bank forecasts it to grow by 5.5% in current fiscal year 2017-18 ending in June 2018, a full percentage point faster than the 4.5% average GDP growth for Emerging and Developing Economies (EMDEs) that include Argentina, Brazil, China, India, Nigeria and Russia among others. However, Pakistan economic growth continues to lag growth forecast for regional economies of India and Bangladesh. The report also calls attention to the expanding current account gap as a matter of concern that must be taken seriously by the government to avoid yet another return to the International Monetary Fund (IMF).

Related Links:

Haq's Musings

CPEC is Transforming Least Developed Parts of Pakistan

Per Capita Income in "Failed State" of  Pakistan Rose 22% in 5 Years

Credit Suisse Wealth Report 2017

Pakistan Translates GDP Growth to Citizens' Well-being

Rising Motorcycle Sales in Pakistan

Depth of Deprivation in India

Chicken vs Daal in Pakistan

China Pakistan Economic Corridor

Thursday, January 11, 2018

World Bank: Pakistan Outperforming Emerging Economies Average

The World Bank sees Pakistan's GDP to grow 5.5% in current fiscal year 2017-18 ending in June 2018, a full percentage point faster than the 4.5% average GDP growth for Emerging and Developing Economies (EMDEs) that include Argentina, Brazil, China, India, Nigeria and Russia among others. However, Pakistan economic growth continues to lag growth forecast for regional economies of India and Bangladesh. The report also highlights the issue to growing trade deficit and current account gap that could lead to yet another balance of payments crisis for Pakistan requiring another IMF bailout.

Source: World Bank Group
Pakistan GDP Growth: 

Here's an excerpt of the January 2018 World Bank report titled "Global Economic Prospects" as it relates to Pakistan:

"In Pakistan, growth continued to accelerate in FY2016/17 (July-June) to 5.3 percent, somewhat below the government’s target of 5.7 percent as industrial sector growth was slower than expected. Activity was strong in construction and services, and there was a recovery in agricultural production with a return of normal monsoon rains. In the first half of FY2017/18, activity has continued to expand, driven by robust domestic demand supported by strong credit growth and investment projects related to the China-Pakistan Economic Corridor. Meanwhile, the current account deficit widened to 4.1 percent of GDP compared to 1.7 percent last year, amid weak exports and buoyant imports."

Growing External Account Imbalance: 

The report correctly points out the problem of growing current account deficit that could turn into a balance of payments crisis unless the trade deficits are brought under control. Recent trends in the last three months do offer some hope with December 2017 exports up 15% while imports increased 10%. Exports in November increased 12.3%.

Along with double digit increase in exports in the last two months, Pakistan received remittances amounting to $1.724 billion in December 2017, 8.72% higher compared with $1.585 billion the country received in the same month of the previous year, according to data released by the State Bank of Pakistan (SBP), as reported by Express Tribune.

Summary:

Pakistan's economic growth is continuing to accelerate amid rising rising investments led by China-Pakistan Economic Corridor related infrastructure and energy related projects.  The World Bank sees Pakistan's GDP to grow 5.5% in current fiscal year 2017-18 ending in June 2018, a full percentage point faster than the 4.5% average GDP growth for Emerging and Developing Economies (EMDEs) that include Argentina, Brazil, China, India, Nigeria and Russia among others. However, Pakistan economic growth continues to lag growth forecast for regional economies of India and Bangladesh. The report also calls attention to the expanding current account gap as a matter of concern that must be taken seriously by the government to avoid yet another return to the International Monetary Fund (IMF).

Related Links:

Haq's Musings

CPEC is Transforming Least Developed Parts of Pakistan

Per Capita Income in "Failed State" of  Pakistan Rose 22% in 5 Years

Credit Suisse Wealth Report 2017

Pakistan Translates GDP Growth to Citizens' Well-being

Rising Motorcycle Sales in Pakistan

Depth of Deprivation in India

Chicken vs Daal in Pakistan

China Pakistan Economic Corridor


Friday, November 18, 2016

World Bank Reports Big Jump in Living Standards of Poor Pakistanis

A November 2016 World Bank report says that Pakistan has successfully translated economic growth into the well-being of its poorest citizens. It says "Pakistan’s recent growth has been accompanied by a staggering fall in poverty".

Rising incomes of the poorest 20% in Pakistan since 2002 have enabled them to enhance their living standards by improving their diets and acquiring television sets, refrigerators, motorcycles, flush toilets, and better housing.

Another recent report titled "From Wealth to Well Being" by Boston Consulting Group (BCG) also found that Pakistan does better than India and China in translating GDP growth to citizens' well-being.

One particular metric BCG report uses is growth-to-well-being coefficient on which Pakistan scores 0.87, higher than India's 0.77 and China's 0.75.

Big Poverty Decline Since 2002:

Using the old national poverty line of $1.90 (ICP 2011 PPP) , set in 2001, the percentage of people living in poverty fell from 34.7 percent in FY02 to 9.3 percent in FY14—a fall of more than 75 percent. Much of the socioeconomic progress reported by the World Bank since 2000 has occurred during President Musharraf's years in office from 2000-2007. It has dramatically slowed or stagnated since 2010.

Source: World Bank Report Nov 2016

Using the new 2016 poverty line of $3.50 (ICP 2011 PPP),  29.5 percent of Pakistanis as poor (using the latest available data from FY14). By back casting this line, the poverty rate in FY02 would have been about 64.3 percent.

Pakistan's new poverty line sets a minimum consumption threshold of Rs. 3,030 or $105 (ICP 2011 PPP) per person per month or $3.50 (ICP 2011 PPP) per person per day. This translates to between Rs. 18,000 and Rs. 21,000 per month for a household at the poverty line, allowing nearly 30% of the population or close to 60 million people to be targeted for pro-poor and inclusive development policies—thus setting a much higher bar for inclusive development.

Multi-dimensional Poverty Decline:

A UNDP report released in June 2016 said Pakistan’s MPI (Multi-dimensional poverty index) showed a strong decline, with national poverty rates falling from 55% to 39% from 2004 to 2015. MPI goes beyond just income poverty.

The Multidimensional Poverty Index uses a broader concept of poverty than income and wealth alone. It reflects the deprivations people experience with respect to health, education and standard of living, and is thus a more detailed way of understanding and alleviating poverty. Since its development by OPHI and UNDP in 2010, many countries, including Pakistan, have adopted this methodology as an official poverty estimate, complementing consumption or income-based poverty figures.

Rising Living Standards of the Poorest 20% in Pakistan:

According to the latest World Report titled "Pakistan Development Update: Making Growth Matter" released this month, Pakistan saw substantial gains in welfare, including the ownership of assets, the quality of housing and an increase in school enrollment, particularly for girls.


First, the ownership of relatively more expensive assets increased even among the poorest. In the bottom quintile, the ownership of motorcycles increased from 2 to 18 percent, televisions from 20 to 36 percent and refrigerators from 5 to 14 percent.

In contrast, there was a decline in the ownership of cheaper assets like bicycles and radios.


Housing quality in the bottom quintile also showed an improvement. The number of homes constructed with bricks or blocks increased while mud (katcha) homes decreased. Homes with a flushing toilet almost doubled in the bottom quintile, from about 24 percent in FY02 to 49 percent in FY14.

Dietary Improvements for the Poorest 20% in Pakistan:

Decline in poverty led to an increase in dietary diversity for all income groups.

For the poorest, the share of expenditure devoted to milk and milk products, chicken, eggs and fish rose, as did the share devoted to vegetables and fruits.

In contrast, the share of cereals and pulses, which provide the cheapest calories, declined steadily between FY02 and FY14. Because foods like chicken, eggs, vegetables, fruits, and milk and milk products are more expensive than cereals and pulses, and have lower caloric content, this shift in consumption also increased the amount that people spent per calorie over time.

For the poorest quintile, expenditure per calorie increased by over 18 percent between FY02 and FY14. Overall, this analysis confirms that the decline in poverty exhibited by the 2001 poverty line is quite credible, and that Pakistan has done remarkably well overall in reducing monetary poverty based on the metric it set some 15 years ago, says the World Bank.

Summary:

In spite of Pakistan's many challenges on multiple fronts, the country has successfully translated its GDP growth into the well-being of its poorest citizens. "Pakistan’s recent growth has been accompanied by a staggering fall in poverty", says a November 2016 World Bank report.  An earlier report by Boston Consulting Group reached a similar conclusion.

Related Links:

Haq's Musings

Pakistan Translates GDP Growth to Citizens' Well-being

Rising Motorcycle Sales in Pakistan

Depth of Deprivation in India

Chicken vs Daal in Pakistan

China Pakistan Economic Corridor

ADB Raises Pakistan GDP Growth Forecast

Friday, June 13, 2014

World Bank Reports Sharp Downward Revision in Pakistan Poverty

Oops! The World Bank made a big mistake. The number of Pakistanis living below the 2005 $1.25 poverty line (set at $1.44 for 2011) is 4.8 million, less than one-seventh of the 35.1 million reported earlier.  It is a huge drop from about 20% of the population to 3% of the population living below the international poverty line.
World Bank's Revised Poverty Estimates (Source: CGD)

Poverty rates for many other nations, including India and Bangladesh,  have also seen dramatic downward revisions. As a result, India now has 102 million poor, just slightly above China's 99 million. In fact, the new report has cut the world poverty rate in half from 19.7% to 8.9%. Reduction from 21% to 3% for Pakistan poverty is much sharper than the rest of the world because ICP 2011 found it to be the second cheapest in the world.

The revision became necessary after the World Bank's International Comparison Program (ICP) completed a detailed study of a list of around 800 household and non-household products to compare real purchasing power for trans-national income comparison program (ICP). The 2011 ICP findings concluded that Pakistan's per capita income is US$4,450.00, just slightly below India's US$4,735.00

Here's how the Center for Global Development blog post by Sarah Dykstra, Charles Kenny and Justin Sandefur explains the reasons for the latest revisions:

"In checking our methodology (prompted by Laurence Chandy, to whom thanks), we realize that we underestimated the impact of the new PPP lines on poverty due to two mistakes in the computer code underlying the original version of this post: we used 2010 CPI figures where we meant to use 2011, and conversely, we used 2011 population figures where we meant to use 2010."

The CDG post explains the new poverty figures for Pakistan and many other developing countries as follows:

"What lies behind the dramatic changes in calculated GDP and poverty rates? A big factor may be that the national inflation rates used to convert incomes into 2005 PPP dollars in the last few years appear to be higher than the rate of inflation reflected in the baskets of goods and services measured by the two rounds of ICP surveys: Pakistan’s PPP conversion rate for GDP was 19.1 Rupees to the dollar in 2005 and 24.4 in 2011 — a gentle increase of 28 percent. The Consumer Price Index in Pakistan has gone up 102 percent over that same period. That might reflect changing or inadequate ICP commodity baskets or consumption data in one or both years, or mismeasurement of prices by Pakistan’s statistical agencies. But whatever the reason, it appears to apply to a lot of countries. Very few places saw PPP conversion rates climb close to or more than CPIs between 2005 and 2011, which is why poverty rates based on the 2011 PPP numbers tend to be lower."

The CDG staffers have offered the following apology to everyone who used their incorrect data: "We have egg on our faces. We're very sorry to those who quoted our original estimates and are contacting a number of them to notify them of the mistake and updated post".

Related Links:

Haq's Musings

Pakistan's Revised PPP GDP 2011

Pakistan Among Top 25 World Economies

Pakistan's Per Capita Income

Pakistan Fares Better Than Neighbors on World Misery Index

Pakistan's Underground Economy

India Pakistan Comparison 

Pakistan Economic History

Pakistan's Expected Demographic Dividend

Wednesday, April 30, 2014

World Bank ICP 2011 Calculates Pakistan PPP GDP at $788 Billion

Pakistan is the second least expensive country in the world. Pakistan's GDP is $788 billion as of 2011 based on purchasing power parity (PPP), according to International Comparisons Program (ICP) findings 2011 released yesterday by the World Bank.

World Bank's International Comparison Program (ICP) does a detailed study of a list of around 800 household and nonhousehold products to compare real purchasing power for trans-national income comparison program (ICP). The latest ICP findings conclude that Pakistan's per capita income is US$4,450.00, just slightly below India's US$4,735.00

ICP Based GDP Per Capita. Source: World Bank


At US$4,450 per capita, Pakistan's PPP GDP works out to US$788 billion for 2011, and more than a trillion US dollars now.

The results of an earlier ICP program for 2005 and 2006 released by Asian Development Bank in 2009 concluded that Pakistan's per capita income was HK$ 13,528.  It reported India’s per capita as HK $12,090.

Price Level Index Rankings. Source: World Bank


The ICP program uses Price Level Index (PLI) as an indicator of cost of living in a country. It defines PLI as the ratio of a PPP (purchasing power parity) to a corresponding exchange rate. An index over 100 means prices are higher on average than in the world, and one less than 100 means prices are relatively lower. Pakistan's PLI of 28.2 ranks it at 176, just above the last-ranked Egypt's PLI of 27.2 at 177. India's PLI of 32.4 ranks it at 127.

23 economies are showing a PLI of 50 or below. The cheapest economies are Egypt, Pakistan, Myanmar, Ethiopia and Lao People's Democratic Republic, with indices ranging from 35 to 40.

The most expensive economies in GDP terms are Switzerland, Norway, Bermuda, Australia and Denmark, with indices ranging from 210 to 185. The United States ranked 25th in the world, lower than most other high-income economies, including France, Germany, Japan, and the United Kingdom.

Here are some of the other major findings of World Bank ICP 2011:

1. The six largest middle income economies – China, India, Russia, Brazil, Indonesia and Mexico – account for 32.3 percent of world GDP, whereas the 6 largest high income economies – United States, Japan, Germany, France, United Kingdom, and Italy – account for 32.9 percent.

2. Asia and the Pacific, including China and India, accounts for 30 percent of world GDP, Eurostat-OECD 54 percent, Latin America 5.5 percent (excluding Mexico, which participates in the OECD and Argentina, which did not participate in the ICP 2011), Africa and Western Asia about 4.5 percent each.

3. China and India make up two-thirds of the Asia and the Pacific economy, excluding Japan and South Korea, which are part of the OECD comparison.

4. Russia accounts for more than 70 percent of the CIS, and Brazil for 56 percent of Latin America.

5. South Africa, Egypt, and Nigeria account for about half of the African economy.

Last week, another survey done by Cato Institute found that Pakistan fares better than its neighbors on world misery index. Back in 1960s, distinguished American economist Arthur Okun defined misery index as sum of inflation and unemployment rates. America's high misery index was cited by candidate Jimmy Carter as a reason to elect him president in his 1976 presidential race against President Gerald R. Ford. The Cato Institute has now revived it by adding interest rates to the sum of inflation and unemployment rates and subtracting per capita GDP growth rate from it.

Pakistan (score 21.9) at 28 ranks below Iran (score 61.6) at 2 and India (score 25.6) at 19 on world misery index rankings for 2013 compiled by Washington's Cato Institute. Other nations worse off than Pakistan on the list include Serbia, Argentina, Jamaica, Egypt, Spain, South Africa, Brazil, Greece, Macedonia, Palestine, Turkey, Cyprus, Croatia, Dominican Republic, Georgia, Nicaragua, Honduras, Costa Rica, Jordan, Ukraine, Peru, Uruguay, Portugal and Barbados. Indonesia (score 21.6) at 29 is only slightly better off than Pakistan.

Earlier this year, Economist Intelligence Unit's latest Worldwide Cost of Living survey revealed that Pakistan’s Karachi is the second cheapest city of the world in 2014 while India’s Mumbai is the cheapest. The top 10 cheapest cities include Mumbai, Karachi, New Delhi, Kathmandu, Damascus, Algiers, Bucharest, Panama City, Jeddah and Riyadh in that order, according to EIU.

Related Links:

Haq's Musings

Pakistan's Per Capita Income

Pakistan Fares Better Than Neighbors on World Misery Index

Pakistan's Underground Economy

India Pakistan Comparison 

Pakistan Economic History\

Pakistan's Expected Demographic Dividend