Showing posts with label Living Standards. Show all posts

Sunday, October 23, 2022

Multidimensional Poverty: India is Home to 75% of World's Population Deprived of Basic Living Standards

Over 75% of the world's poor deprived of basic living standards (nutrition, cooking fuel, sanitation and housing) live in India compared to 4.6% in Bangladesh and 4.1% in Pakistan, according to a recently released OPHI/UNDP report on multidimensional poverty.  Here's what the report says: "More than 45.5 million poor people are deprived in only these four indicators (nutrition, cooking fuel, sanitation and housing). Of those people, 34.4 million live in India, 2.1 million in Bangladesh and 1.9 million in Pakistan—making this a predominantly South Asian profile". 

Global Multidimensional Poverty Index 2022. Source: OPHI/UNDP

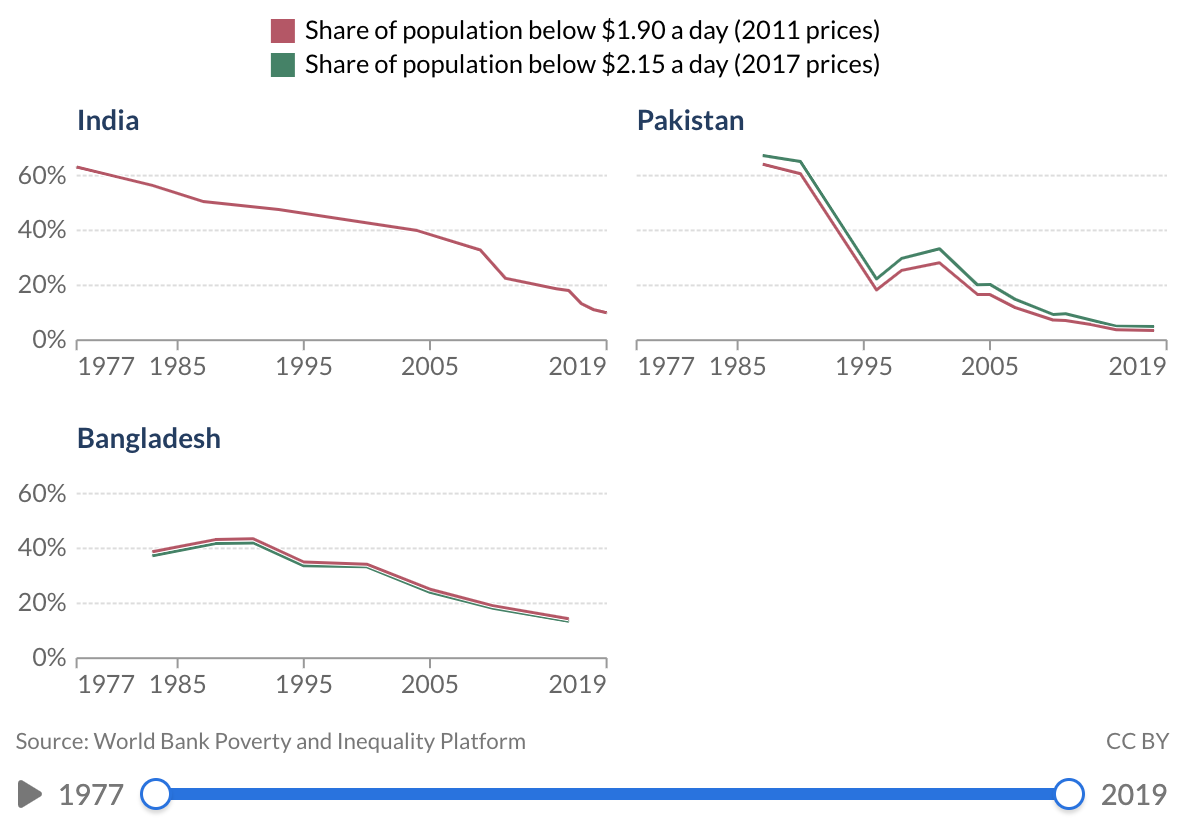
Income Poverty in Bangladesh, India and Pakistan. Source: Our World in Data


The UNDP poverty report shows that the income poverty (people living on $1.90 or less per day) in Pakistan is 3.6% while it is 22.5% in India and 14.3% in Bangladesh. In terms of the population vulnerable to multidimensional poverty, Pakistan (12.9%) does better than Bangladesh (18.2%) and India (18.7%)  However, Pakistan fares worse than India and Bangladesh in multiple dimensions of poverty. The headline multidimensional poverty (MPI) figure for Pakistan (0.198) is worse than for Bangladesh (0.104) and India (0.069). This is primarily due to the education and health deficits in Pakistan. Adults with fewer than 6 years of schooling are considered multidimensionally poor by OPHI/UNDP.  Income poverty is not included in the MPI calculations. The data used by OHP/UNDP for MPI calculation is from years 2017/18 for Pakistan and from years 2019/2021 for India. 

Multidimensional Poverty in South Asia. Source: UNDP

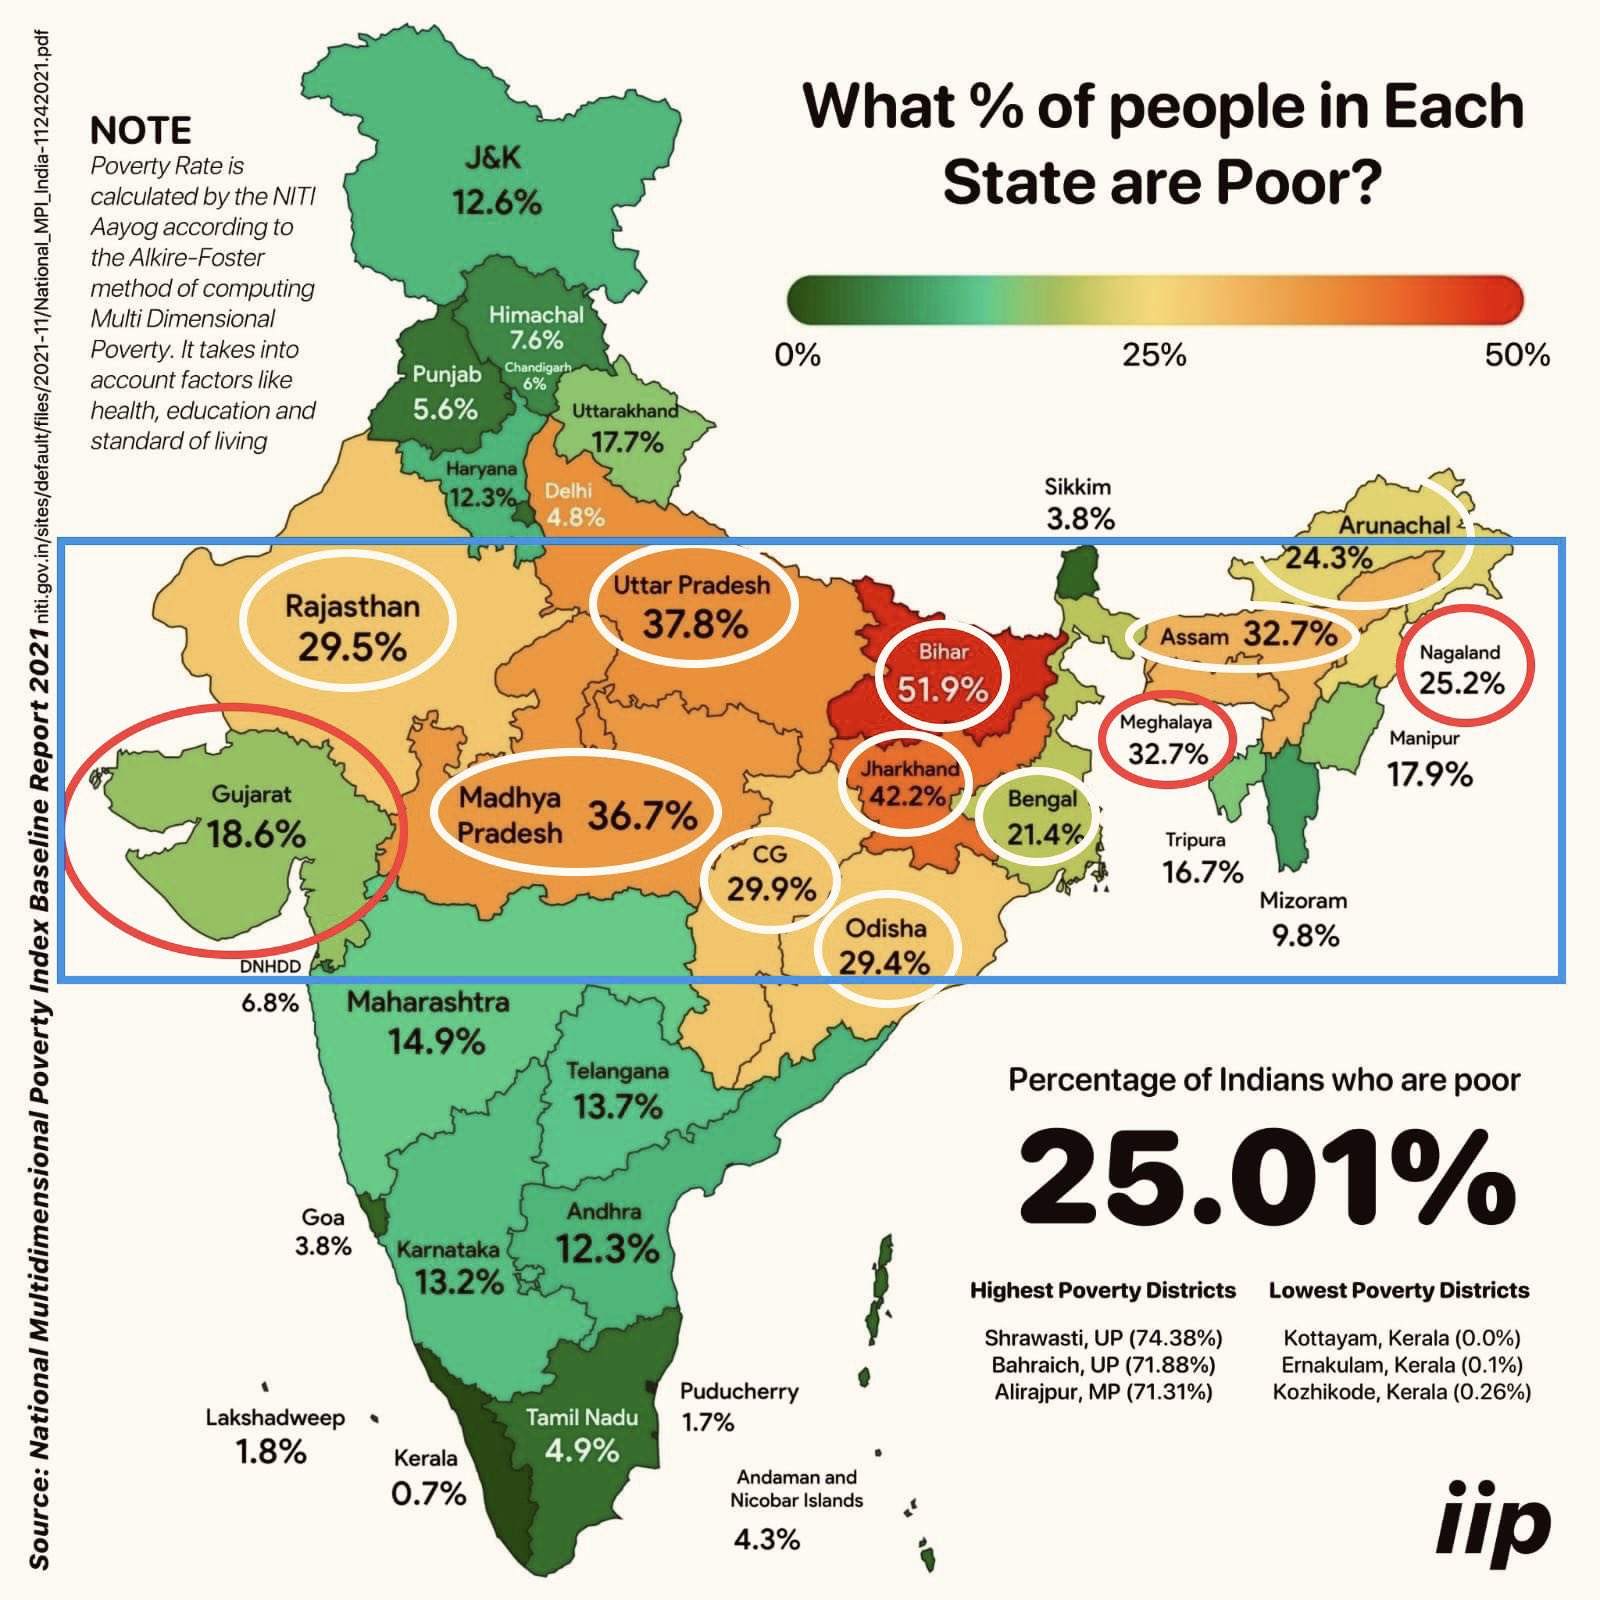
The Indian government's reported multidimensional poverty rate of 25.01% is much higher than the OPHI/UNDP estimate of 16.4%. NITI Ayog report released in November 2021 says: "India’s national MPI identifies 25.01 percent of the population as multidimensionally poor".

Multidimensional Poverty in India. Source: NITI Ayog via IIP

Earlier this year,  Global Hunger Index 2022 reported that  India ranks 107th for hunger among 121 nations. The nation fares worse than all of its South Asian neighbors except for war-torn Afghanistan ranked 109, according to the the report. Sri Lanka ranks 64, Nepal 81, Bangladesh 84 and Pakistan 99. India and Pakistan have levels of hunger that are considered serious. Both have slipped on the hunger charts from 2021 when India was ranked 101 and Pakistan 92.  Seventeen countries, including Bosnia, China, Kuwait, Turkey and UAE, are collectively ranked between 1 and 17 for having a score of less than five.

Related Links:


Haq's Musings

South Asia Investor Review

Pakistan Among World's Largest Food Producers

Pakistan Floods 2022

Food in Pakistan 2nd Cheapest in the World

India in Crisis: Unemployment and Hunger Persist After COVID

Impact of Russia Sanctions on Food, Fuel Availability

Record Number of Indians Seeking Asylum in US

Vast Majority of Pakistanis Support Imran Khan's Handling of Covid19 Crisis

Incomes of Poorest Pakistanis Growing Faster Than Their Richest Counterparts

Pakistanis Consuming More Calories, Fruits & Vegetables Per Capita 

How Grim is Pakistan's Social Sector Progress?

Pakistan Fares Marginally Better Than India On Disease Burdens

COVID Lockdown Decimates India's Middle Class

Pakistan Child Health Indicators

Pakistan's Balance of Payments Crisis

How Has India Built Large Forex Reserves Despite Perennial Trade Deficits

Riaz Haq's Youtube Channel

Tuesday, December 5, 2017

Rising Share of Income of Poorest 20% Pakistani Households

The share of national income of Pakistan's poorest 20% of households has increased from 8.1% to 9.6% since 1990 , according to the United Nations Economic and Social Commission for Asia and Pacific (NESCAP) Statistical Yearbook for 2015.  It's the highest share of income for the bottom income quintile in the region.

Income Share Change in Asia's Poorest Quintile: 

The countries where people in the poorest income quintile have increased their share of total income include Kyrgyzstan (from 2.5 per cent to 7.7), the Russian Federation (4.4 per cent to 6.5), Kazakhstan (7.5 per cent to 9.5) and Pakistan (8.1 per cent to 9.6).  India's bottom income quintile has seen its share of income drop from 9% to 7.8%.

Bottom Quintile Income Share Change. Source: UNESCAP Statistical Yearbook

Although more people in China have lifted themselves out of poverty than any other country in the world, the poorest quintile in that country now accounts for a lower percentage of total income (4.7 per cent) than in the early 1990s (8.0 per cent). The same unfortunate trend is observed for a number of other countries, including in Indonesia (from 9.4 per cent to 7.6) and in the Lao People’s Democratic Republic (from 9.3 per cent to 7.6).

Credit Suisse Wealth Report 2017:

Data released by Credit Suisse with its Global Wealth Report 2017 shows that Pakistan is the most egalitarian nation in South Asia. It also confirms that the median wealth of Pakistani households is three times higher than that of households in India.

Here is per capita wealth data for India and Pakistan as of mid-2017, according to Credit Suisse Wealth Report 2017 released recently.

Pakistan average wealth per adult: $5,174 vs India $5,976
Pakistan median wealth per adult: $3,338 vs India $1,295

Average household wealth in Pakistan is $15,522 (3 adults) vs India $14,940 (2.5 adults)
Median household wealth in Pakistan is $10,014  (3 adults) vs India $3,237 (2.5 adults)

Pakistan Gini Index 52.6% vs India 83%

World Bank Update on Pakistan: 

A November 2016 World Bank report says that Pakistan has successfully translated economic growth into the well-being of its poorest citizens. It says "Pakistan’s recent growth has been accompanied by a staggering fall in poverty".

Rising incomes of the poorest 20% in Pakistan since 2002 have enabled them to enhance their living standards by improving their diets and acquiring television sets, refrigerators, motorcycles, flush toilets, and better housing.

Another recent report titled "From Wealth to Well Being" by Boston Consulting Group (BCG) also found that Pakistan does better than India and China in translating GDP growth to citizens' well-being.

One particular metric BCG report uses is growth-to-well-being coefficient on which Pakistan scores 0.87, higher than India's 0.77 and China's 0.75.

Big Poverty Decline Since 2002:

Using the old national poverty line of $1.90 (ICP 2011 PPP) , set in 2001, the percentage of people living in poverty fell from 34.7 percent in FY02 to 9.3 percent in FY14—a fall of more than 75 percent. Much of the socioeconomic progress reported by the World Bank since 2000 has occurred during President Musharraf's years in office from 2000-2007. It has dramatically slowed or stagnated since 2010.

Source: World Bank Report Nov 2016

Using the new 2016 poverty line of $3.50 (ICP 2011 PPP),  29.5 percent of Pakistanis as poor (using the latest available data from FY14). By back casting this line, the poverty rate in FY02 would have been about 64.3 percent.

Pakistan's new poverty line sets a minimum consumption threshold of Rs. 3,030 or $105 (ICP 2011 PPP) per person per month or $3.50 (ICP 2011 PPP) per person per day. This translates to between Rs. 18,000 and Rs. 21,000 per month for a household at the poverty line, allowing nearly 30% of the population or close to 60 million people to be targeted for pro-poor and inclusive development policies—thus setting a much higher bar for inclusive development.

Multi-dimensional Poverty Decline:

A UNDP report released in June 2016 said Pakistan’s MPI (Multi-dimensional poverty index) showed a strong decline, with national poverty rates falling from 55% to 39% from 2004 to 2015. MPI goes beyond just income poverty.

The Multidimensional Poverty Index uses a broader concept of poverty than income and wealth alone. It reflects the deprivations people experience with respect to health, education and standard of living, and is thus a more detailed way of understanding and alleviating poverty. Since its development by OPHI and UNDP in 2010, many countries, including Pakistan, have adopted this methodology as an official poverty estimate, complementing consumption or income-based poverty figures.

Rising Living Standards of the Poorest 20% in Pakistan:

According to the latest World Report titled "Pakistan Development Update: Making Growth Matter" released this month, Pakistan saw substantial gains in welfare, including the ownership of assets, the quality of housing and an increase in school enrollment, particularly for girls.


First, the ownership of relatively more expensive assets increased even among the poorest. In the bottom quintile, the ownership of motorcycles increased from 2 to 18 percent, televisions from 20 to 36 percent and refrigerators from 5 to 14 percent.

In contrast, there was a decline in the ownership of cheaper assets like bicycles and radios.


Housing quality in the bottom quintile also showed an improvement. The number of homes constructed with bricks or blocks increased while mud (katcha) homes decreased. Homes with a flush toilet almost doubled in the bottom quintile, from about 24 percent in FY02 to 49 percent in FY14.

Dietary Improvements for the Poorest 20% in Pakistan:

Decline in poverty led to an increase in dietary diversity for all income groups.

For the poorest, the share of expenditure devoted to milk and milk products, chicken, eggs and fish rose, as did the share devoted to vegetables and fruits.

In contrast, the share of cereals and pulses, which provide the cheapest calories, declined steadily between FY02 and FY14. Because foods like chicken, eggs, vegetables, fruits, and milk and milk products are more expensive than cereals and pulses, and have lower caloric content, this shift in consumption also increased the amount that people spent per calorie over time.

For the poorest quintile, expenditure per calorie increased by over 18 percent between FY02 and FY14. Overall, this analysis confirms that the decline in poverty exhibited by the 2001 poverty line is quite credible, and that Pakistan has done remarkably well overall in reducing monetary poverty based on the metric it set some 15 years ago, says the World Bank.

Summary:

Pakistan is among the most economically egalitarian nations in the world.  In spite of the country's many challenges on multiple fronts, it has successfully translated its GDP growth into the well-being of its poorest citizens. The share of national income of Pakistan's poorest 20% of households has increased from 8.1% to 9.6% since 1990, according to the United Nations Economic and Social Commission for Asia and Pacific (NESCAP) Statistical Yearbook for 2015.  It's the highest share of income for the bottom income quintile in the region. "Pakistan’s recent growth has been accompanied by a staggering fall in poverty", says a November 2016 World Bank report.  An earlier report by Boston Consulting Group reached a similar conclusion.

Related Links:

Haq's Musings

Credit Suisse Wealth Report 2017

Pakistan Translates GDP Growth to Citizens' Well-being

Rising Motorcycle Sales in Pakistan

Depth of Deprivation in India

Chicken vs Daal in Pakistan

China Pakistan Economic Corridor

Friday, November 18, 2016

World Bank Reports Big Jump in Living Standards of Poor Pakistanis

A November 2016 World Bank report says that Pakistan has successfully translated economic growth into the well-being of its poorest citizens. It says "Pakistan’s recent growth has been accompanied by a staggering fall in poverty".

Rising incomes of the poorest 20% in Pakistan since 2002 have enabled them to enhance their living standards by improving their diets and acquiring television sets, refrigerators, motorcycles, flush toilets, and better housing.

Another recent report titled "From Wealth to Well Being" by Boston Consulting Group (BCG) also found that Pakistan does better than India and China in translating GDP growth to citizens' well-being.

One particular metric BCG report uses is growth-to-well-being coefficient on which Pakistan scores 0.87, higher than India's 0.77 and China's 0.75.

Big Poverty Decline Since 2002:

Using the old national poverty line of $1.90 (ICP 2011 PPP) , set in 2001, the percentage of people living in poverty fell from 34.7 percent in FY02 to 9.3 percent in FY14—a fall of more than 75 percent. Much of the socioeconomic progress reported by the World Bank since 2000 has occurred during President Musharraf's years in office from 2000-2007. It has dramatically slowed or stagnated since 2010.

Source: World Bank Report Nov 2016

Using the new 2016 poverty line of $3.50 (ICP 2011 PPP),  29.5 percent of Pakistanis as poor (using the latest available data from FY14). By back casting this line, the poverty rate in FY02 would have been about 64.3 percent.

Pakistan's new poverty line sets a minimum consumption threshold of Rs. 3,030 or $105 (ICP 2011 PPP) per person per month or $3.50 (ICP 2011 PPP) per person per day. This translates to between Rs. 18,000 and Rs. 21,000 per month for a household at the poverty line, allowing nearly 30% of the population or close to 60 million people to be targeted for pro-poor and inclusive development policies—thus setting a much higher bar for inclusive development.

Multi-dimensional Poverty Decline:

A UNDP report released in June 2016 said Pakistan’s MPI (Multi-dimensional poverty index) showed a strong decline, with national poverty rates falling from 55% to 39% from 2004 to 2015. MPI goes beyond just income poverty.

The Multidimensional Poverty Index uses a broader concept of poverty than income and wealth alone. It reflects the deprivations people experience with respect to health, education and standard of living, and is thus a more detailed way of understanding and alleviating poverty. Since its development by OPHI and UNDP in 2010, many countries, including Pakistan, have adopted this methodology as an official poverty estimate, complementing consumption or income-based poverty figures.

Rising Living Standards of the Poorest 20% in Pakistan:

According to the latest World Report titled "Pakistan Development Update: Making Growth Matter" released this month, Pakistan saw substantial gains in welfare, including the ownership of assets, the quality of housing and an increase in school enrollment, particularly for girls.


First, the ownership of relatively more expensive assets increased even among the poorest. In the bottom quintile, the ownership of motorcycles increased from 2 to 18 percent, televisions from 20 to 36 percent and refrigerators from 5 to 14 percent.

In contrast, there was a decline in the ownership of cheaper assets like bicycles and radios.


Housing quality in the bottom quintile also showed an improvement. The number of homes constructed with bricks or blocks increased while mud (katcha) homes decreased. Homes with a flushing toilet almost doubled in the bottom quintile, from about 24 percent in FY02 to 49 percent in FY14.

Dietary Improvements for the Poorest 20% in Pakistan:

Decline in poverty led to an increase in dietary diversity for all income groups.

For the poorest, the share of expenditure devoted to milk and milk products, chicken, eggs and fish rose, as did the share devoted to vegetables and fruits.

In contrast, the share of cereals and pulses, which provide the cheapest calories, declined steadily between FY02 and FY14. Because foods like chicken, eggs, vegetables, fruits, and milk and milk products are more expensive than cereals and pulses, and have lower caloric content, this shift in consumption also increased the amount that people spent per calorie over time.

For the poorest quintile, expenditure per calorie increased by over 18 percent between FY02 and FY14. Overall, this analysis confirms that the decline in poverty exhibited by the 2001 poverty line is quite credible, and that Pakistan has done remarkably well overall in reducing monetary poverty based on the metric it set some 15 years ago, says the World Bank.

Summary:

In spite of Pakistan's many challenges on multiple fronts, the country has successfully translated its GDP growth into the well-being of its poorest citizens. "Pakistan’s recent growth has been accompanied by a staggering fall in poverty", says a November 2016 World Bank report.  An earlier report by Boston Consulting Group reached a similar conclusion.

Related Links:

Haq's Musings

Pakistan Translates GDP Growth to Citizens' Well-being

Rising Motorcycle Sales in Pakistan

Depth of Deprivation in India

Chicken vs Daal in Pakistan

China Pakistan Economic Corridor
ADB Raises Pakistan GDP Growth Forecast