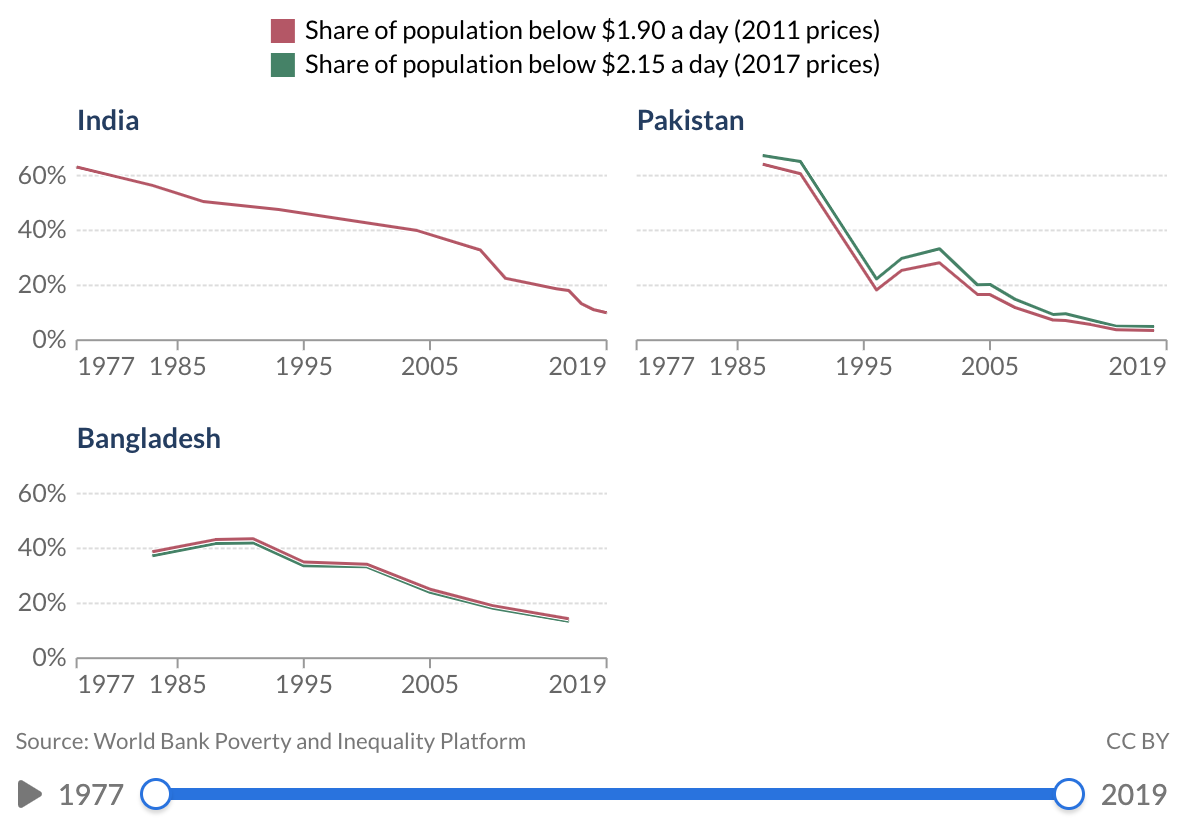
Is Bangladesh's officially reported GDP figure credible? Do consumption figures support Bangladesh's claim of higher per capita income than India and Pakistan? Is it the recent rebasing of GDP that boosted Bangladesh's per capita income above India's and Pakistan's? If Bangladesh has higher GDP per capita, why is its per capita consumption of energy, cement and steel so much lower than India's and Pakistan's? Does Pakistan really have a much larger informal economy than Bangladesh or India do? How long has it been since Pakistan rebased its GDP calculations? Is there a lot more currency in circulation in Pakistan than in Bangladesh and India? Let us try and answer these questions!
Rebasing GDP:
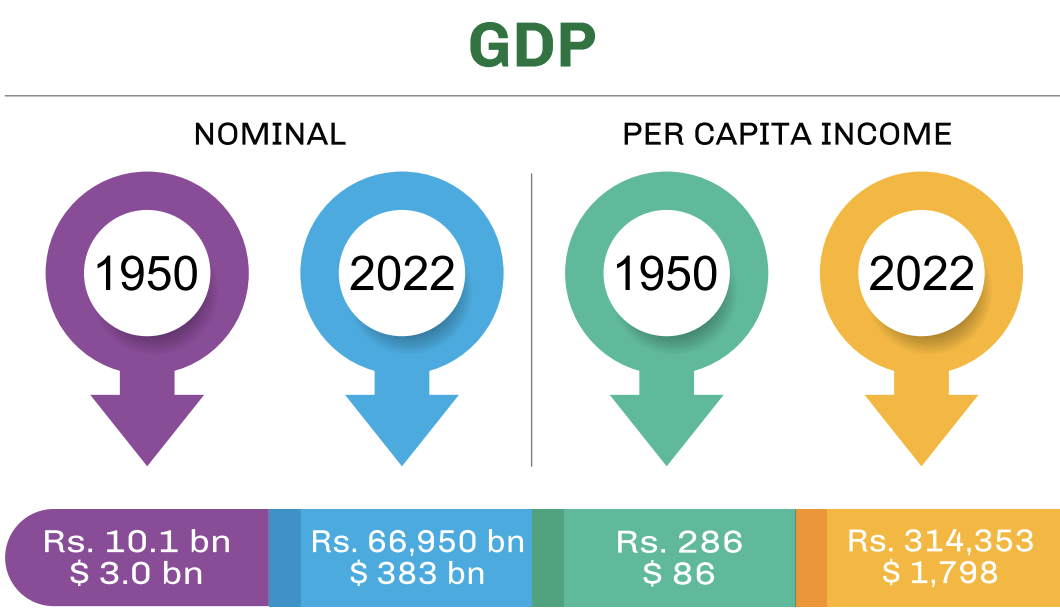
Bangladesh just rebased its GDP in 2020-21 to year 2015-16. This has boosted its per capita income by double digits for every year since 2015-16. Bangladesh's per capita income for the 2015-16 fiscal year has now gone up to $1,737 from $1,465 in the old calculation. For the 2019-2020 fiscal, the per capita income has gone up to $2,335 from $2,024. The new GDP estimate covers 21 sectors, up from 15 sectors previously. India last rebased its GDP in 2015, a change that bumped up its per capita GDP by double digits. Nigeria's last rebasing in 2012 increased the size of its economy (GDP) by nearly 90%. Pakistan's current base year is 2005-6. Rebasing which is now long overdue will almost certainly increase Pakistan's per capita income by double digits.
In its 2014 annual report, the State Bank of Pakistan talked about a number of new sectors that are either under-reported or not covered at all: "In terms of LSM growth, a number of sectors that are showing strong performance; (for example, fast moving consumer goods (FMCG) sector; plastic products; buses and trucks; and even textiles), are either under reported, or not even covered. The omission of such important sectors from official data coverage, probably explains the apparent disconnect between overall economic activity in the country and the hard numbers in LSM."
Pakistan's last economic census was done in 2003 and published in 2005, livestock census in 2006 and agriculture census in 2010. The country's economy has changed significantly since then, adding several new economic activities while others may have diminished. The Quantum Index of Large Scale Manufacturing (QIM) with 2005-06 base year gives a weight to textiles of 20.9% (Yarn 13.7 and cloth 7.2). But the textile industry has significantly changed as reflected in its exports. The value added textiles (non-yarn and non-cloth) now make almost 80% of the total textile exports. These changes are not reflected in current GDP calculations.
Energy consumption:
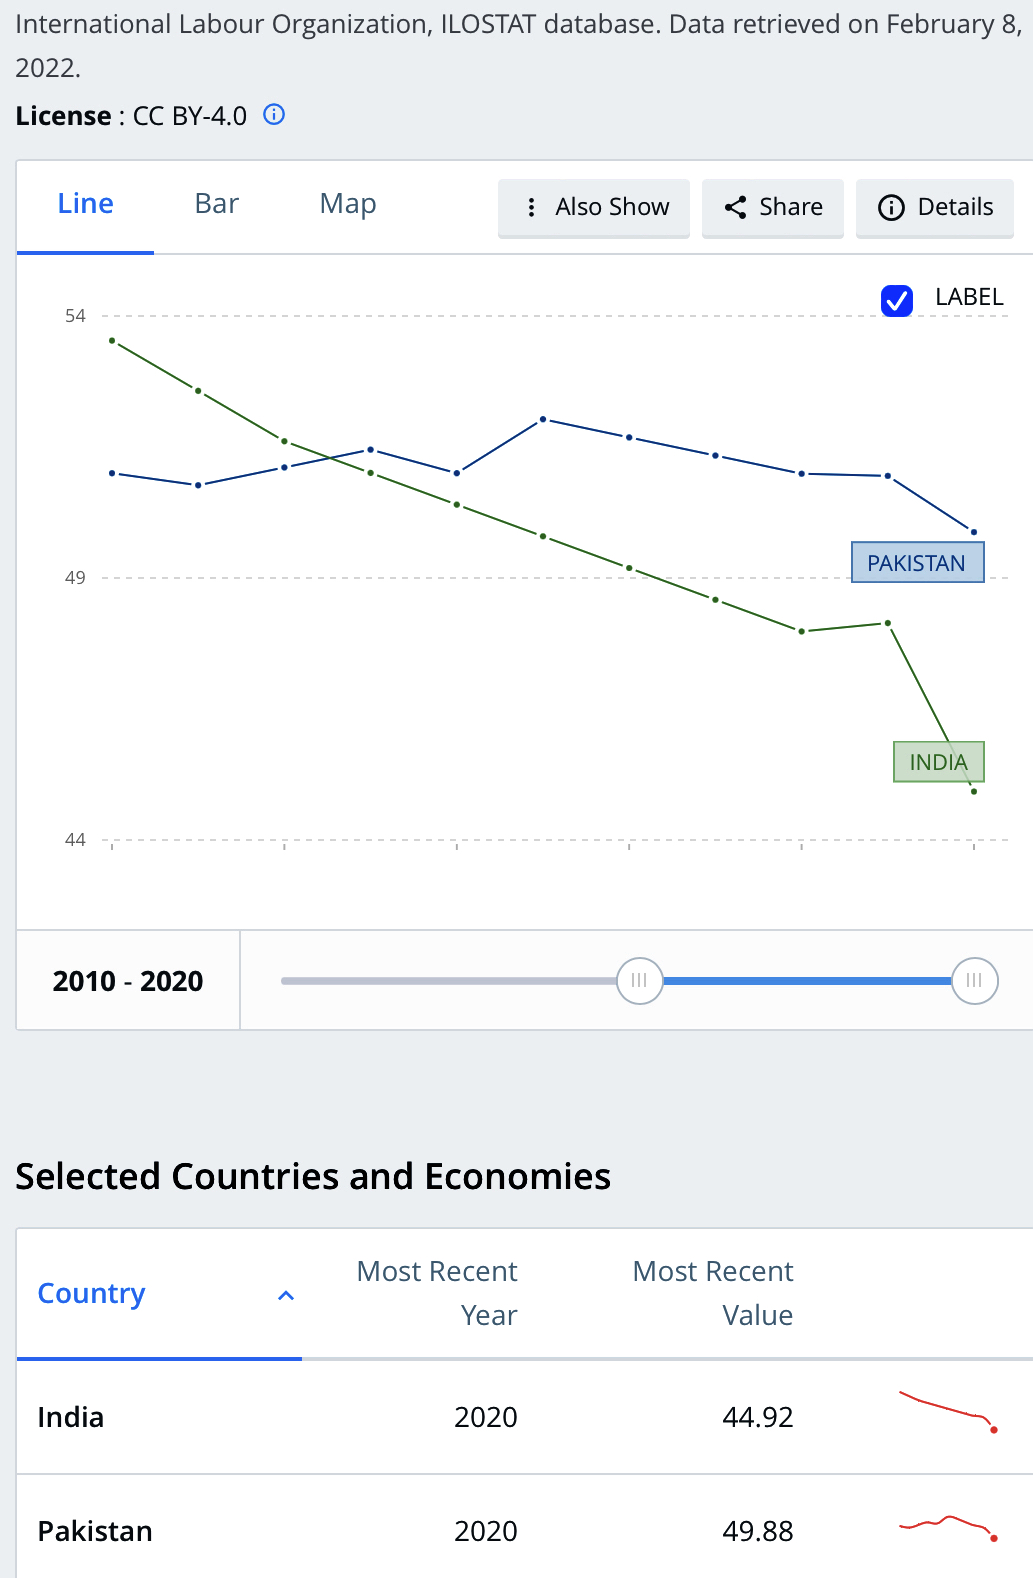
Life in modern times is heavily dependent on energy. Per capita energy consumption, a key barometer of economic activity, is significantly lower in Bangladesh than in India and Pakistan. Use of electricity per capita in Bangladesh is significantly less than in India and Pakistan.
Commercial energy use (kg of oil equivalent per capita) above refers to apparent consumption, which is equal to indigenous production plus imports and stock changes, minus exports and fuels supplied to ships and aircraft engaged in international transport. It's only 142 Kg of oil per capita in Bangladesh, much lower than 463 Kg in Pakistan and 494 Kg in India.
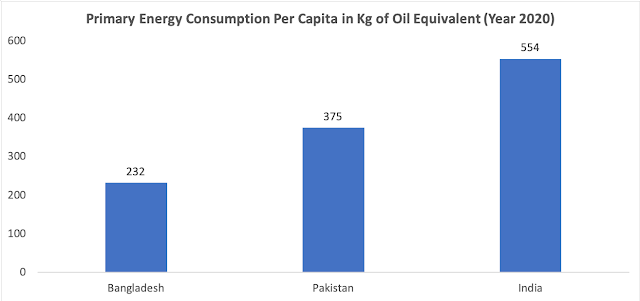
A more recent British Petroleum "Statistical Review of World Energy 2021" puts the per capita primary energy consumption at 9.7 Gigajoules (232 kilogram of oil equivalent) for Bangladesh, 15.7 Gj (375 kgoe) for Pakistan and 23.2 Gj (554 kgoe) for India.
Per capita consumption of primary energy in Bangladesh has grown by 59% (6.1 Gj to 9.7 Gj) since 2010, much faster than 25% (18.2 Gj to 23.2 Gj) in India and just 6% (14.8 Gj to 15.7 Gj) in Pakistan, according to the British Petroleum's "Statistical Review of World Energy 2021". This indicates much faster economic growth in Bangladesh than India or Pakistan in the last decade.
Cement Consumption:
Use of cement is another important indicator of economic and development activities, particularly in the infrastructure and housing construction sector. China and the United States, the world's biggest economies, also have the highest consumption of cement.
Steel Consumption:
Per capita steel consumption is another important indicator of economic activity in both construction and manufacturing sectors. It goes into building housing and infrastructure as well manufacturing vehicles and home appliances. The United States and China, the world's biggest economies, are the largest consumers of steel.
Bangladesh is among the lowest consumers of steel products in the world. Per capita consumption of finished steel in Bangladesh (41 Kg) is lower than the regional peer Myanmar (40.5), India (75.3), Pakistan (45.7), Sri Lanka (53.5), according to the World Steel Association (WSA).
Pakistan's Informal Economy:
One way to estimate the size of the informal economy in any country is by looking at the amount of currency in circulation relative to overall money supply. This data is published regularly by all central banks in South Asia and elsewhere. Pakistan's currency in circulation to M2 ratio (about 30%) is more than double the ratios in Bangladesh (13%) and India (15%), indicating that the informal economy in Pakistan is much bigger.
Dr. Lalarukh Ejaz, an assistant professor at the Institute of Business Administration in Karachi, has estimated the size of Pakistan’s informal economy at 56% of the country’s GDP (as of 2019). This means that it’s worth around $180 billion a year, and that is a massive amount by any yardstick.
Vehicles and home appliance ownership data analyzed by Dr. Jawaid Abdul Ghani of Karachi School of Business Leadership suggests that the officially reported GDP significantly understates Pakistan's actual GDP. Indeed, many economists believe that Pakistan’s economy is at least double the size that is officially reported in the government's Economic Surveys.
Back in 2014, the State Bank of Pakistan stated in its Annual Report as follows: "In terms of LSM growth, a number of sectors that are showing strong performance; (for example, fast moving consumer goods (FMCG) sector; plastic products; buses and trucks; and even textiles), are either under reported, or not even covered. The omission of such important sectors from official data coverage, probably explains the apparent disconnect between overall economic activity in the country and the hard numbers in LSM." Pakistan's GDP has not been rebased in more than a decade. It was last rebased in 2005-6 while India’s was rebased in 2011. The recent rebasing of Bangladesh GDP to year 2015 has boosted its per capita income of Bangladesh for year 2016-16 and all subsequent years . The per capita income for the 2015-16 fiscal year has now gone up to $1737 from $1465 in the old calculation For the 2019-2020 fiscal, the per capita income has gone up to $2335 from $2024. Just rebasing the Pakistani economy will result in double digit increases in GDP for the last several years.
 |
Estimates of Informal Economies in Asia in 2012. Source: IMF
A research paper by economists Ali Kemal and Ahmad Waqar Qasim of PIDE (Pakistan Institute of Development Economics) estimated in 2012 that the Pakistani economy’s size then was around $400 billion. All they did was look at the consumption data to reach their conclusion. They used the data reported in regular PSLM (Pakistan Social and Living Standard Measurements) surveys on actual living standards. They found that a huge chunk of the country's economy is undocumented.
|
Pakistan's Service Sector:
Pakistan's service sector which contributes more than 50% of the country's GDP is mostly cash-based and least documented. Compared to Bangladesh and India, there is a lot more currency in circulation as a percentage of overall money supply in Pakistan. According to the State Bank of Pakistan (SBP), the currency in circulation has increased to Rs. 7.4 trillion by the end of the financial year 2020-21, up from Rs 6.7 trillion in the last financial year, a double-digit growth of 10.4% year-on-year. Currency in circulation (CIC), as percent of M2 money supply and currency-to-deposit ratio, has been increasing over the last few years. The CIC/M2 ratio is now close to 30%, according to the State Bank of Pakistan. The average CIC/M2 ratio in FY18-21 was measured at 28%, up from 22% in FY10-15. This 1.2 trillion rupee increase could have generated undocumented GDP of Rs 3.1 trillion at the historic velocity of 2.6, according to a report in The Business Recorder. In comparison to Bangladesh (CIC/M2 at 13%), Pakistan’s cash economy is double the size. Even a casual observer can see that the living standards in Pakistan are higher than those in Bangladesh and India.
Exports:
Pakistan has performed poorly in exports growth relative to Bangladesh and India since about 2007. This has been the key source of its balance of payments crises and its repeated need for IMF bailouts. Pakistan's economic growth has essentially been constrained by its recurring balance of payment (BOP) crises as explained by Thirlwall's Law.
Summary:
Bangladesh just rebased its GDP in 2020-21 to year 2015-16. This has boosted its per capita income by double digits for every year since 2015-16, raising it above India's and Pakistan's. Based on published data on energy, cement and steel consumption, Bangladesh's claim of having a per capita GDP higher than India's and Pakistan's does not seem credible. In this age of growing energy-intensive industrialization, it does not make sense to have significantly lower use of key inputs like energy to produce higher gross domestic product. For Pakistan, it is important for policymakers to promote ways of documenting more of the economy. It's also important for finance officials to rebase the country's GDP to a more recent year than the year 2006 when it was last done.
Related Links:
Haq's Musings
South Asia Investor Review
Pakistan Among World's Largest Food Producers
Naya Pakistan Housing Program
Food in Pakistan 2nd Cheapest in the World
Indian Economy Grew Just 0.2% Annually in Last Two Years
Pakistan to Become World's 6th Largest Cement Producer by 2030
Pakistan's 2012 GDP Estimated at $401 Billion
Pakistan's Computer Services Exports Jump 26% Amid COVID19 Lockdown
Coronavirus, Lives and Livelihoods in Pakistan
Vast Majority of Pakistanis Support Imran Khan's Handling of Covid19 Crisis
Pakistani-American Woman Featured in Netflix Documentary "Pandemic"
Incomes of Poorest Pakistanis Growing Faster Than Their Richest Counterparts
Can Pakistan Effectively Respond to Coronavirus Outbreak?
How Grim is Pakistan's Social Sector Progress?
Pakistan's Insatiable Appetite For Energy
Trump Picks Muslim-American to Lead Vaccine Effort
COVID Lockdown Decimates India's Middle Class
Pakistan to be World's 7th Largest Consumer Market by 2030
Pakistan's Balance of Payments Crisis
How Has India Built Large Forex Reserves Despite Perennial Trade Deficits
Conspiracy Theories About Pakistan Elections"
PTI Triumphs Over Corrupt Dynastic Political Parties
Strikingly Similar Narratives of Donald Trump and Nawaz Sharif
Nawaz Sharif's Report Card
Riaz Haq's Youtube Channel